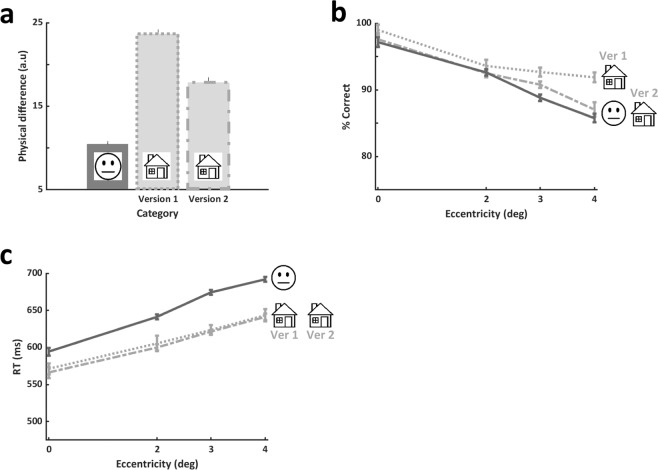
Figure 6.
Relating low level physical differences to performance (all study participants). The physical differences between image pairs (either from the upright face experiment, or from each of the upright house discrimination versions) were compared to performance differences. (a) Mean physical difference between pairs of stimuli in the face discrimination task (on the left) and two versions of the house discrimination task (Ver1 in the middle and Ver2 on the right). There was a significant difference between the two house versions, and house Ver1 had bigger physical difference than that of faces (one way ANOVA on physical difference between experiments: main effect of experiment (F(2,72) = 143.42, p < 0.0001, post-hoc Bonferroni/Dunn Ver1-Ver2: p < 0.0001, Ver2-Faces: p < 0.0001). (b) Accuracy by eccentricity for the different experimental versions. A significant difference in performance between the house discrimination versions was found with no difference between the face experiment and house Ver2 (2-way non-repeated measures ANOVA on accuracy with experiment (house Ver1, house Ver2, Faces) and eccentricity revealed a main effect of version: F(2,280)=9.23, p = 0.0001; post-hoc Bonferroni/Dunn Ver1-Ver2: p = 0.004, Ver2-Faces: p > 0.24). (c) RTs by eccentricity for the different experimental versions. No significant difference between the RTs of both house discrimination versions were found, but as reported in the Results, houses RTs were significantly different (faster) than those of face discrimination (post-hoc Bonferroni/Dunn: Ver1-faces: p = 0.003, Ver2-faces: p = 0.001). Note that accuracy differences may have reflected within category differences, and RTs may have reflected between category physical differences. Nevertheless, inversion, which did not change a category’s physical differences, significantly affected within category performance for both faces and for houses (see Results). Therefore, physical differences may only partially account for performance. Error bars in (a) represent standard error of the mean (SEM), error bars in (b,c) represent standard errors calculated using the Cousineau method.

