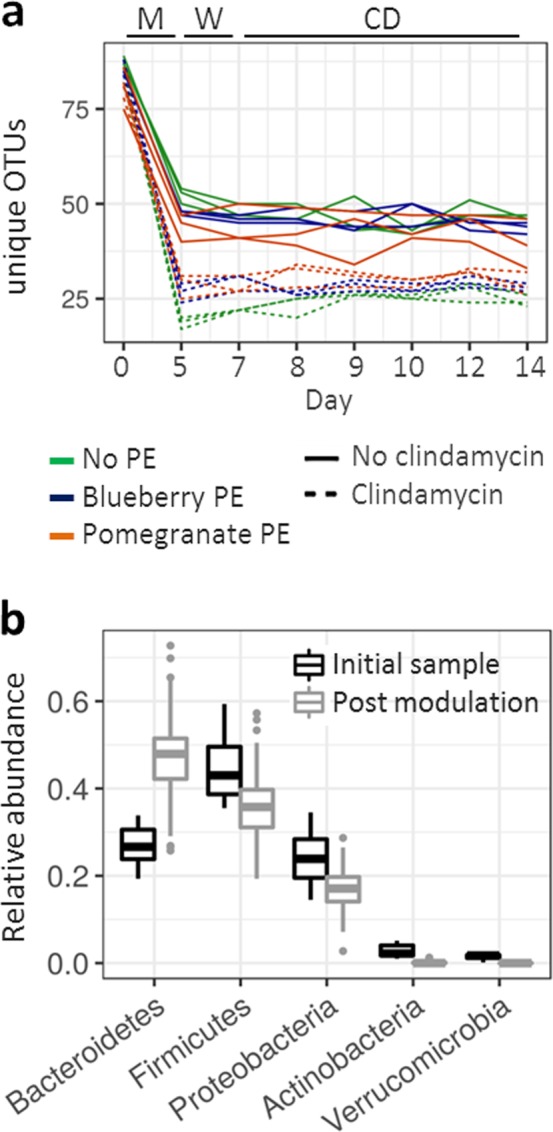
Figure 1.

Bioreactors supported the growth of stable communities. a Number of unique OTUs observed throughout the experiment duration. Color indicates treatment with polyphenol extract (PE), dotted line indicates treatments where clindamycin was used as modulating factor. Letters on the top indicate experimental phase: M – modulation period, W – wash-out period and CD – post C. difficile inoculation period. b Box presentation of the relative abundance of bacterial phyla shown for the samples before the flow initiation (before flow, black) and for all remaining time points (after flow initiation, grey).
