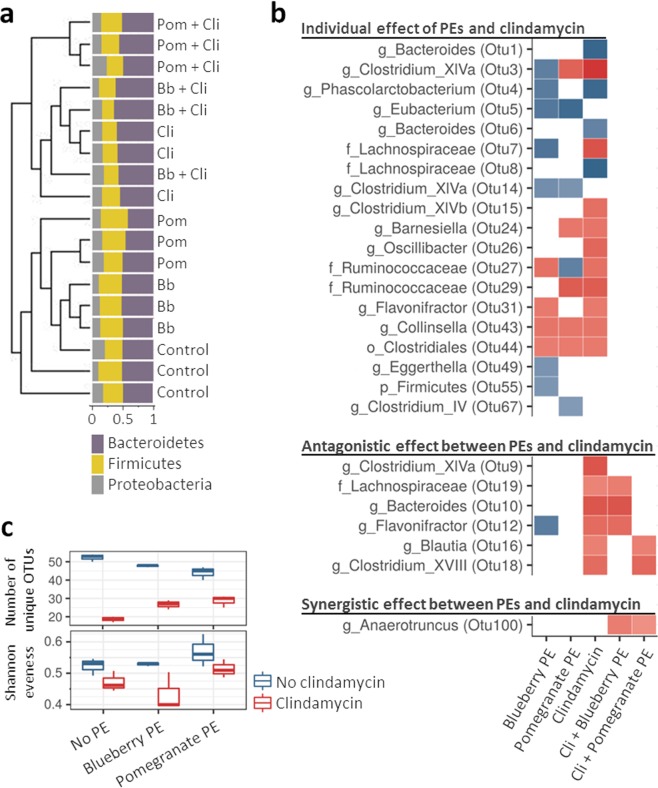
Figure 2.
Polyphenols and clindamycin modulated microbiota in distinct ways. a Dendrogram presentation of Bray-Curtis dissimilarities with the bar-plot presentation of the relative abundance of 3 dominant bacterial phyla. Sample names are colored according to polyphenol extract (PE), that was used during the modulation phase. Green indicates control treatment, blue exposure to blueberry PE and orange exposure to pomegranate PE. Abbreviation “Cli” indicates exposure to clindamycin. b LEfSE analysis showing the comparison between communities exposed to either PE, clindamycin or combination of both compared to the control treatment. LDA values are presented as heat-plot with red indicating a decrease of specific OTU while blue an increase. Letter before OTU taxonomy indicates taxonomic level: g - genus, f - family, o - order, p - phylum. c Box presentation of the number of unique OTUs and Shannon evenness according to the treatment.

