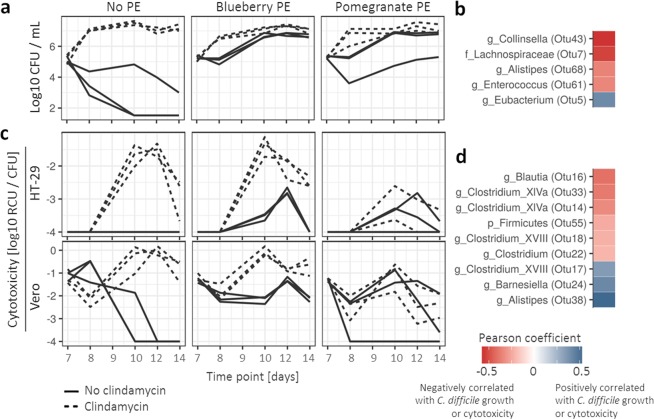
Figure 3.
C. difficile growth- and cytotoxicity-associated bacterial community characteristics. Timeline of C. difficile growth (log10 CFU/mL) (a) and cytotoxicity (log10 Relative Cytotoxicity Units (RCU)/C. difficile CFU) shown for cell lines HT-29 and Vero, separately (c). Dotted line indicates exposure to clindamycin during the modulation phase. b,d Pearson analysis of OTU correlation with C. difficile growth (b) and cytotoxicity (d). Red color indicates negative correlation with either C. difficile growth or cytotoxicity while blue indicates a positive correlation.

