Figure 2.
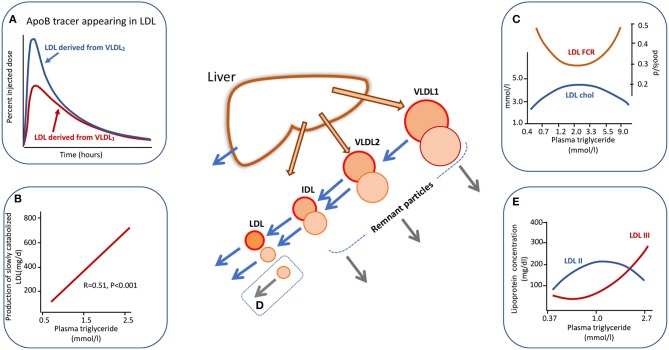
Apolipoprotein B100 metabolic cascade in hypertriglyceridemia. Plasma triglyceride levels influence the metabolism of LDL as an extension of the metabolic heterogeneity seen in Figure 1. LDL is derived from the delipidation of VLDL1 but the extent of conversion is less than for VLDL2. The LDL (followed by virtue of the radioactive label attached to VLDL1 apoB) from VLDL1 has a slow catabolic rate (A). LDL derived from VLDL2 delipidation exhibits a two-phase clearance curve. The first part represents LDL with a rapid clearance rate (presumably derived from directly secreted VLDL2) while the second phase exhibits the same clearance rate as LDL derived from VLDL1. LDL kinetic studies show a positive relationship between the amount of slowly catabolised LDL produced and the plasma triglyceride concentration across the “normal range” (B). Plasma triglyceride across the full range of normal through to severe hypertriglyceridemia exhibits a complex relationship to LDL cholesterol concentration and to LDL fractional catabolic rate (FCR) as shown in (C). Between triglyceride levels of 0.5 to about 3.0 mmol/l FCR falls and LDL concentration rises due to increased production of VLDL1 which is converted to slowly metabolized LDL. In severe hypertriglyceridemia) (>5.0 mmol/l), LDL FCR is increased and the concentration decreases due to rapid clearance by stimulated receptor-independent routes (D). (E) Shows the change in LDL size profile as plasma triglyceride increases. For further detail see Ference et al. (4), Borén et al. (5), Packard and Shepherd (13), Packard et al. (31), and Caslake et al. (48).

