Figure 3.
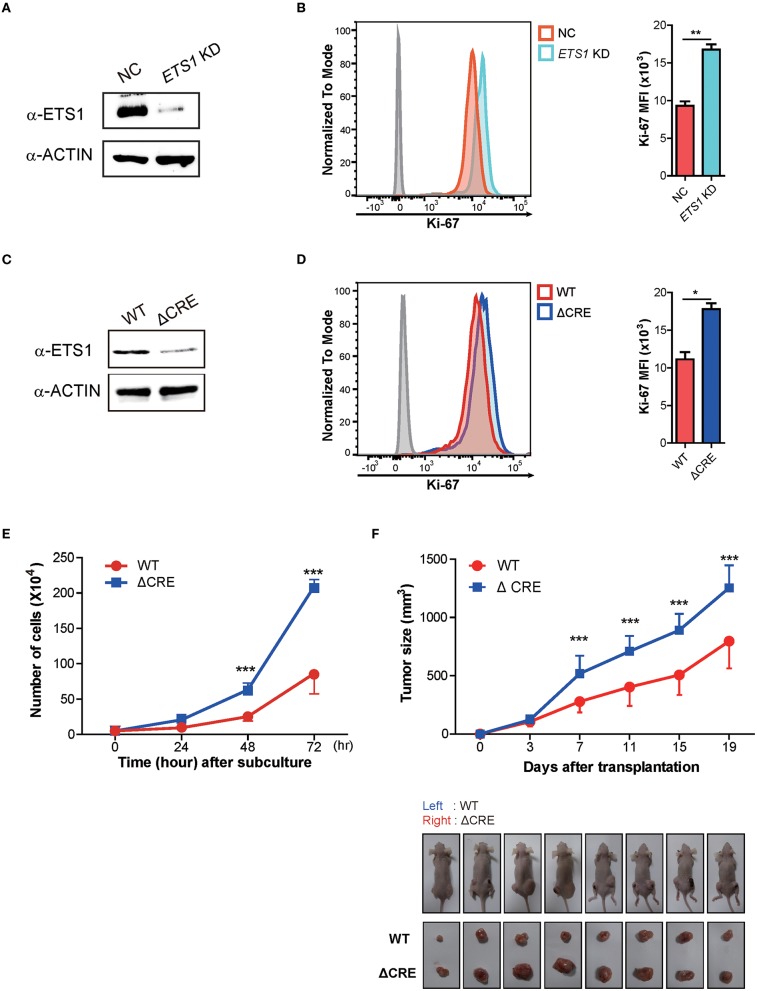
ETS1 inhibits the proliferation and growth of breast cancer cells in vitro as well as in vivo. MDA-MB-231 cells were transfected with negative control (NC) and ETS1 shRNA-GFP reporter vector, and transfected cells were sorted according to GFP-expression. The FACs plots are representative of data from three independent experiments. (A) Immunoblotting analysis for ETS1 protein levels in NC and knockdown cells. (B) Analysis of cell proliferation (Ki-67) comparing NC and ETS1 KD cells. (C) Immunoblotting analysis for levels of ETS1 in MDA-MB-231 (WT) cells and ΔCRE cells. (D) Quantification of cell proliferation based on detection of Ki-67 protein by flow cytometry. (E) Cell count for 72-h culture periods. *P < 0.05, **P < 0.01, ***P < 0.001 (two-way ANOVA with Bonferroni test). (F) Tumor growth curves in nude mice after injection of WT (left) and ΔCRE (right) cells. Tumor volumes were measured at an interval of 4 days (n = 10). Images of representative tumor-bearing mice (top) and isolated tumors (bottom). *P < 0.05, **P < 0.01, ***P < 0.001 (two-way ANOVA with Bonferroni test). Data is representative of three independent experiments. For reasons of clarity, blots were cropped to the bands of interest. Samples derived from the same experiment and gels/blots were processed in parallel. See full-length blots in Supplementary Figure 6.

