Figure 3.
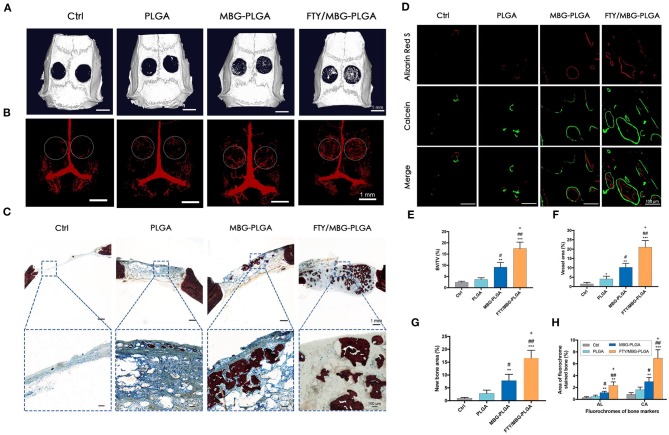
Osteogenesis and aniogenesis in critical sized calvarial bone defects. (A) Micro-CT images for the bone repair in calvarial defects of different groups after 8 weeks of implantation. (B) Micro-CT observation of the newly-formed blood vessels perfused with Microfil in the defect regions (as indicated by the white circle) at week 8. (C) New bone formation observed by Van Gieson's picrofuchsin staining at week 8 (red, new bone; blue, residual material). (D) Sequential fluorescent labeling observation for dynamic bone mineralization, Alizarin Red S (AL, week 4), and Calcein (CA, week 6). Quantitative data (n = 3) from micro-CT analysis of BV/TV, bone volume fractions (E) and blood vessel volume in the defect area (F). The quantitative analysis of the new bone area of Van Gieson's picrofuchsin staining (G) and sequential fluorescent labeling (H). *P < 0.05, **P < 0.01, ***P < 0.001 compared with control group; #P < 0.05, ##P < 0.01 compared with PLGA group; +P < 0.05 compared with MBG-PLGA group. PLGA, poly(lactic-co-glycolic acid); MBG-PLGA, mesoporous bioactive glass and poly(lactic-co-glycolic acid) scaffold; FTY/MBG-PLGA, FTY720 with mesoporous bioactive glass and=poly(lactic-co-glycolic acid) scaffold. Figure and caption reused from Li et al. (2019). Used under the Creative Commons License (https://creativecommons.org/licenses/by-nc-nd/4.0/legalcode).

