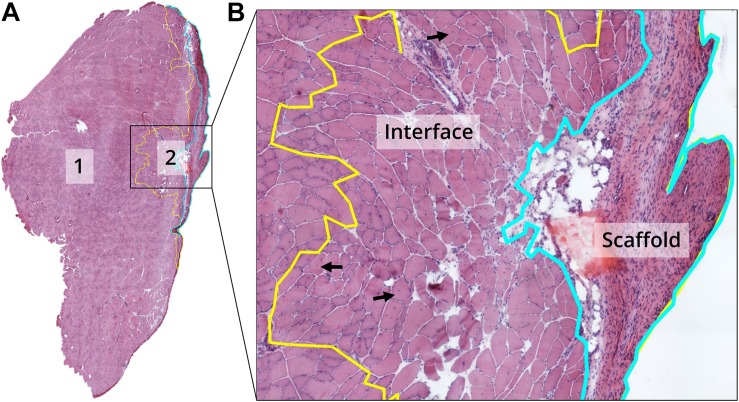
FIGURE 1.
Example of TA muscle cross-section and visual explanation of the different areas used for the quantifications. (A) Example picture of the hematoxylin–eosin (HE) staining of the entire TA muscle (×20 magnification), where we identified and manually traced the remaining native tissue (1) and the injury area (2). (B) Visual explanation of the division of the injury area into two clearly differentiated regions: interface (showing newly formed myofibers with central nuclei, highlighted with black arrows) and scaffold (no visible myofibers are present). Therefore, both the scaffold and interface areas conform the potentially injured/wounded region.

