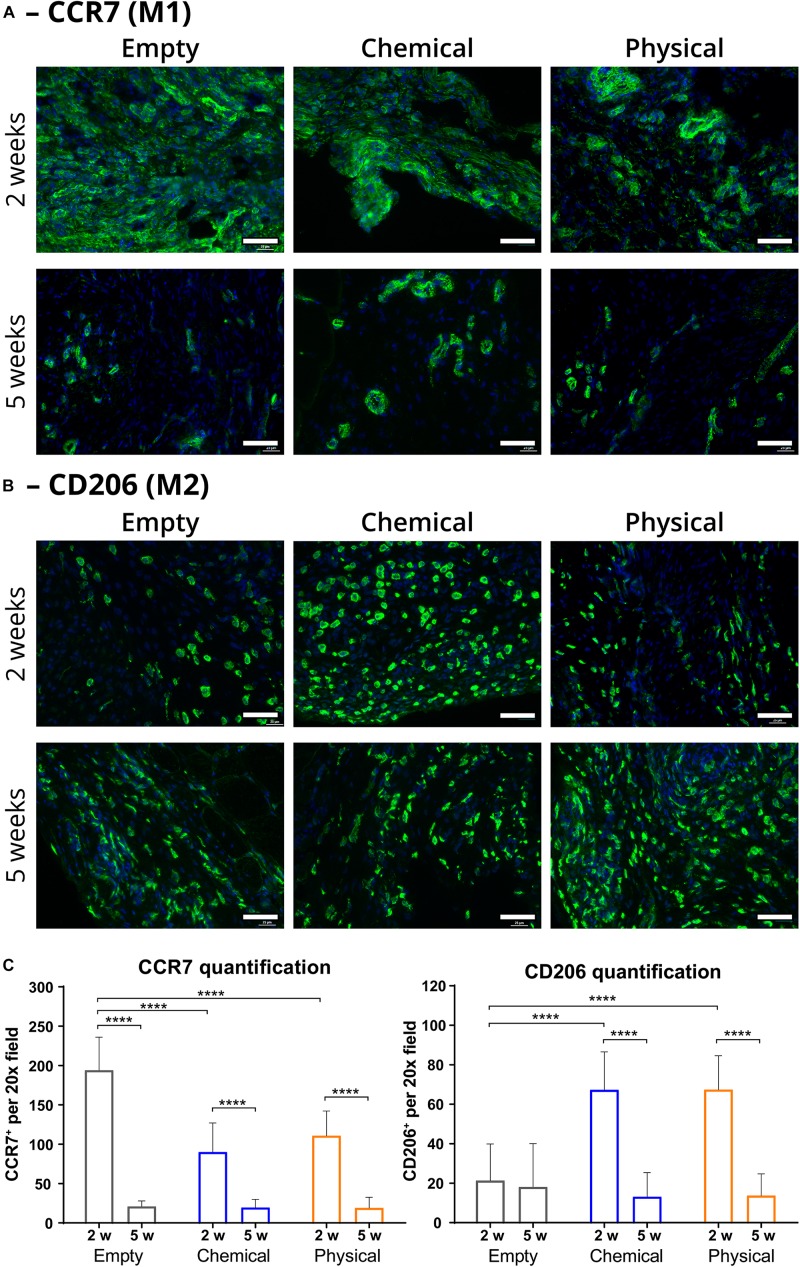
FIGURE 2.
Immunofluorescence representative images and quantification of macrophage populations in the injury area (scaffold and interface regions). (A) Type-1 macrophages (M1 or pro-inflammatory; in green) present in the injury area of samples from the empty (left), chemical (center), and physical (right) groups after 2 (top) and 5 weeks (bottom), labeled with an anti-CCR7 antibody. (B) Type-2 macrophages (M2 or anti-inflammatory; in green) present in the injury area of samples from the empty (left), chemical (center), and physical (right) groups after 2 (top) and 5 weeks (bottom), labeled with an anti-CD206 antibody. (C) Quantification of macrophage populations in the injury area (number of CCR7- or CD206-positive cells per 20× field) at 2 (2 w) and 5 weeks (5 w) post-injury. All the samples were counterstained with DAPI for nuclei. Scale bar = 50 μm. n = at least 16, which are the number of 20× fields used for the quantification. ****p < 0.0001.

