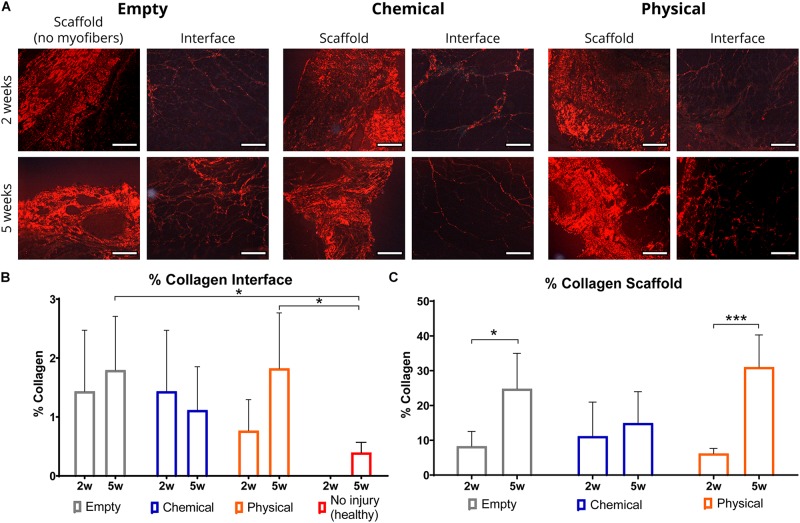
FIGURE 3.
Representative images and quantification for collagen staining with Picrosirius red. (A) Polarized light images from muscle samples of empty (left), chemical (center), and physical (right) groups for the scaffold (area without newly formed myofibers) and interface (area with newly formed myofibers) regions at 2 (top) and 5 weeks (bottom) post-injury. Scale bar = 100 μm. (B,C) Percentage of collagen in the interface (including no injury group at 5 weeks) and scaffold regions, normalized to their areas, after 2 and 5 weeks. *p < 0.05, ***p < 0.001.

