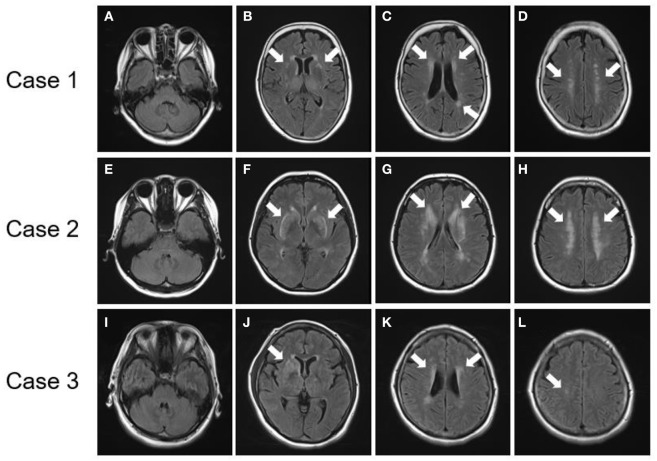
Figure 3.
Brain MRI findings of patients with NOTCH3 mutation. (A–D) FLAIR images of a patient with a NOTCH3 p.R75P mutation (Case 1). (E–H) FLAIR images of a patient with a NOTCH3 p.R75P mutation (Case 2). (I–L) FLAIR images of a patient with a NOTCH3 p.R75P mutation (Case 3). (A,E,I) No patients presented lesions on their temporal pole lobes. (B,F,J) Arrows indicate hyperintensity lesions at external capsules. (C,D,G,H,K,L) Arrows indicate periventricular hyperintensity.

