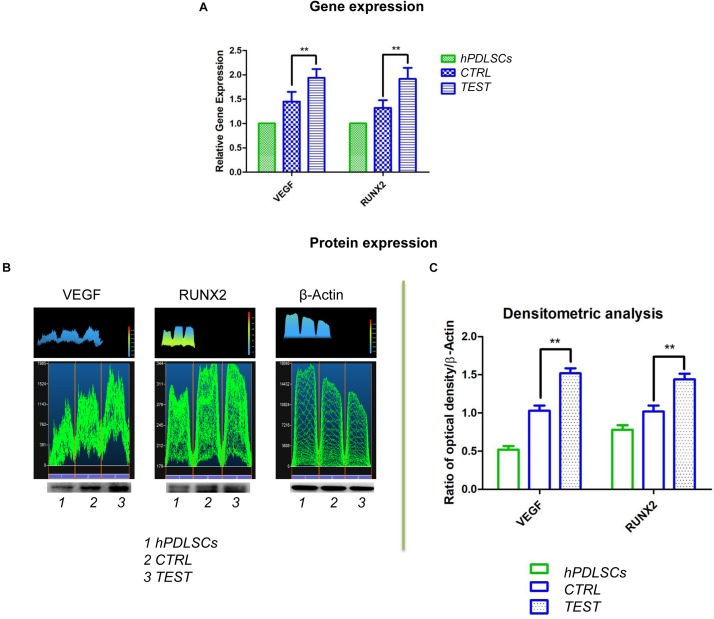
FIGURE 12.
(A) Graph bar of RT-PCR showed the mRNA levels of VEGF and RUNX2 in cells seeded on CTRL and TEST surface after 8 weeks of culture ** p < 0.01. (B) Protein level expression of VEGF and RUNX2 in cells seeded on CTRL and TEST surface after 8 weeks of culture. (C) Graphs evidence densitometric analysis of protein bands expressed as integrated optical intensity (IOI) average of three separate experiments. The error bars on these graphs showed standard deviation (±SD). Densitometric values evaluated by ANOVA return significant differences, ** p < 0.01.

