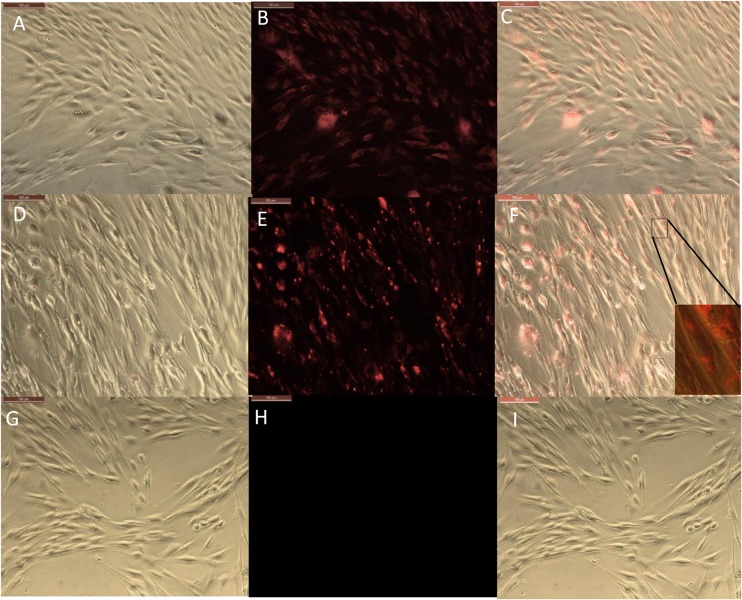
FIGURE 4.
Phase and fluorescence microscopic imaging of primary endothelial cells that were treated with RITC only (A,B), treatment with HNT-RITC formulations (D,E), and treatment with HNT only (G,H) in both phase (right) and fluorescent (middle) settings for 24 h exposure. Merged images for the phase and fluorescence settings (C,F,I). Magnification = 200X, scale bar = 100 μM.

