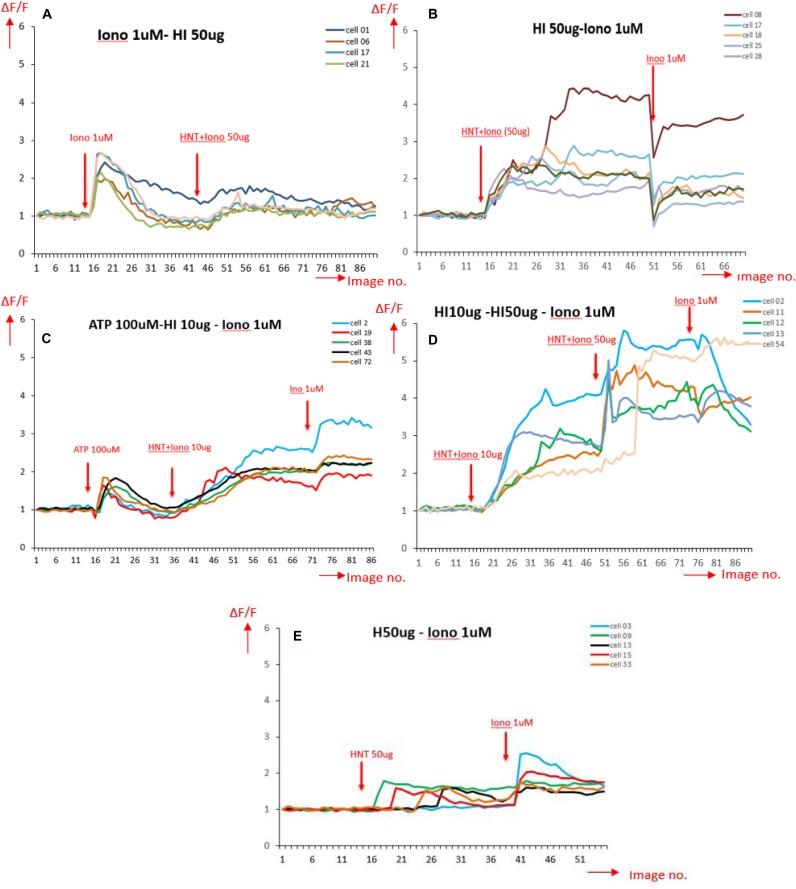
FIGURE 7.
Ca2+ peak intensity obtained for different stimulation on BMVECs, in the horizontal axis is the image number indicating time periods with total range of 4 s each (1 image no. = 4 s); and in the vertical axis is the normalized values for fluorescence intensity corresponding to calcium activity (A) stimulated by ionomycin (Iono) 1 μM (positive control); (B) stimulated by 50 μg/mL HNT- ionomycin (sample tested); (C) stimulated by ATP, a well-known Ca2+ stimulator (positive control indicating healthy cells), followed by HNT-ionomycin formulation (10 μg/mL) showing the comparison between the Ca2+ responses of physiological stimulation (ATP) and HNT-ionomycin formulation for the same cells. (D) Cells stimulated by 10 and 50 μg/mL of HNT-ionomycin showing comparative results for the cells when stimulated by lower and higher dose of HNT-ionomycin; (E) stimulated by 50 μg/mL of empty HNTs (negative control).

