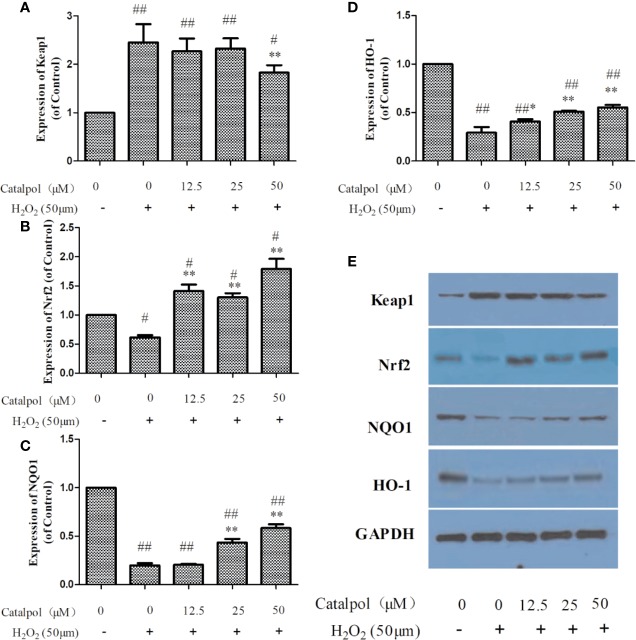
Figure 7.
Effect of CAT (12.5, 25, and 50 μM) on the expressions of Keap1, Nrf2, NQO1 and HO-1 in oxidative stress-injured primary cortical neurons. The columns show quantification of Keap1 (A), Nrf2 (B), NQO1 (C), and HO-1 (D). Representative western blot image (E) showing the relative expressions of Keap1, Nrf2, NQO1, and HO-1 in the groups. Data are expressed as mean ± SD of three independent experiments (*p < 0.05, **p < 0.01 vs. H2O2; #p < 0.05, ##p < 0.01 vs. Control).

