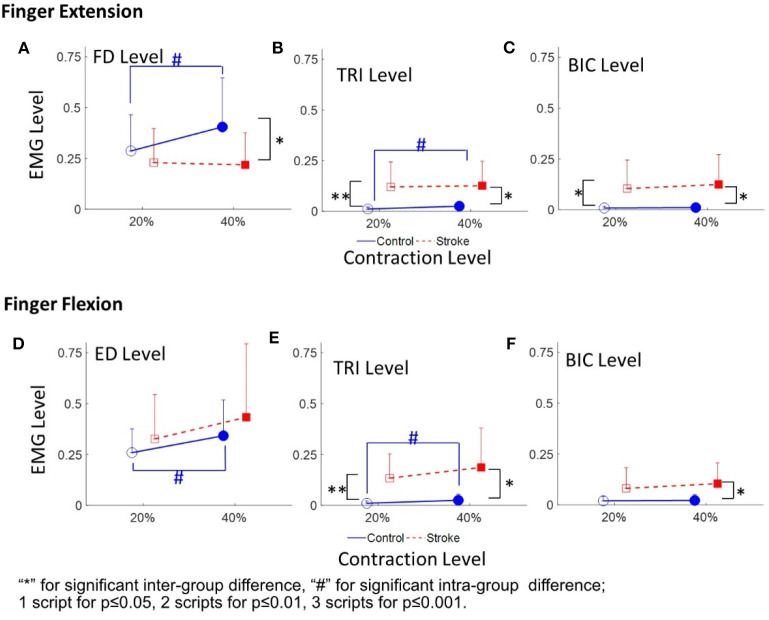
Figure 4.
The EMG activation levels of FD (A), TRI (B), and BIC (C) in 20 and 40% Exs, and the EMG activation levels of ED (D), TRI (E), and BIC (F) in 20 and 40% Fxs, for the two groups. 1 superscript for p ≤ 0.05, 2 superscripts for p ≤ 0.01, 3 superscripts for p ≤ 0.001. The significant inter-group difference is indicated by * (independent t-test), and # is used to indicate the significant intra-group difference (paired t-test).

