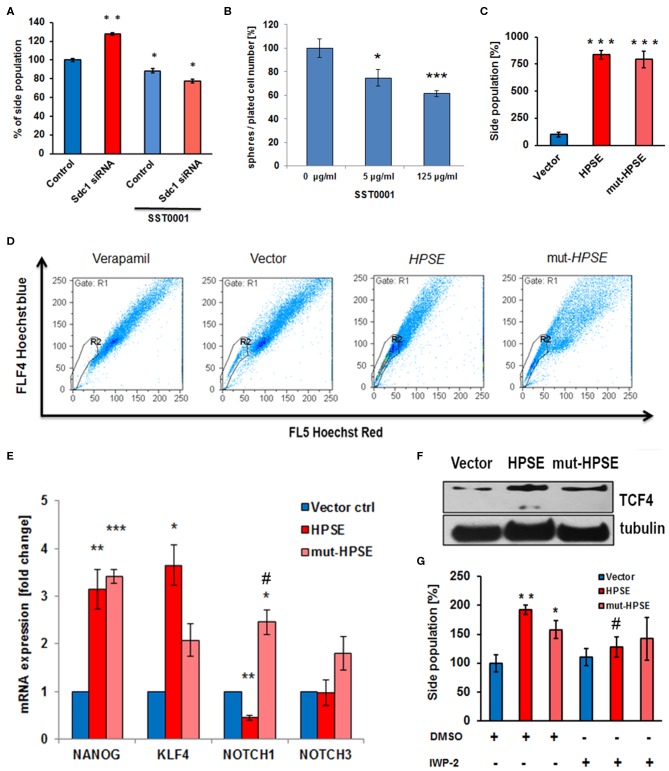
Figure 3.
Heparanase regulates the cancer stem cell phenotype of Caco2 cells. (A) Sdc-1 siRNA knockdown and heparanase inhibition by SST0001 affect the stem cell marker side population in opposite directions. **p < 0.01 vs. all groups. *p < 0.05 vs. untreated control. (B) The HPSE inhibitor SST0001 (10 μg/ml) reduces sphere formation as a readout of stem cell acivity. ***p < 0.001, *p < 0.05 vs. untreated control. (C,D) Overexpression of native and enzymatically inactive forms of HPSE markedly increases the Caco2 side population. ***p < 0.001 vs. vector control. (C) Quantification of flow cytometric data. (D) representative flow cytometric measurements. Verapamil = inhibitor control. (E,F) Overexpression of native and enzymatically inactive forms of HPSE differentially affect the expression of the stem cell markers NANOG, KLF4, NOTCH1, NOTCH3, and TCF4. (E) qPCR, ***p < 0.001, **p < 0.01, *p < 0.05 vs. vector control, #p < 0.05 vs. HPSE. (F) Western-Blot. (G) The Wnt pathway inhibitor IWP2 reduces the enhancing effect of HPSE overexpression on the side population phenotype. **p < 0.01, *p < 0.05 vs. control, #p < 0.05 vs. untreated HPSE. All panels N ≥ 3. Error bars = SEM. (D,F) representative example of three independent experiments.

