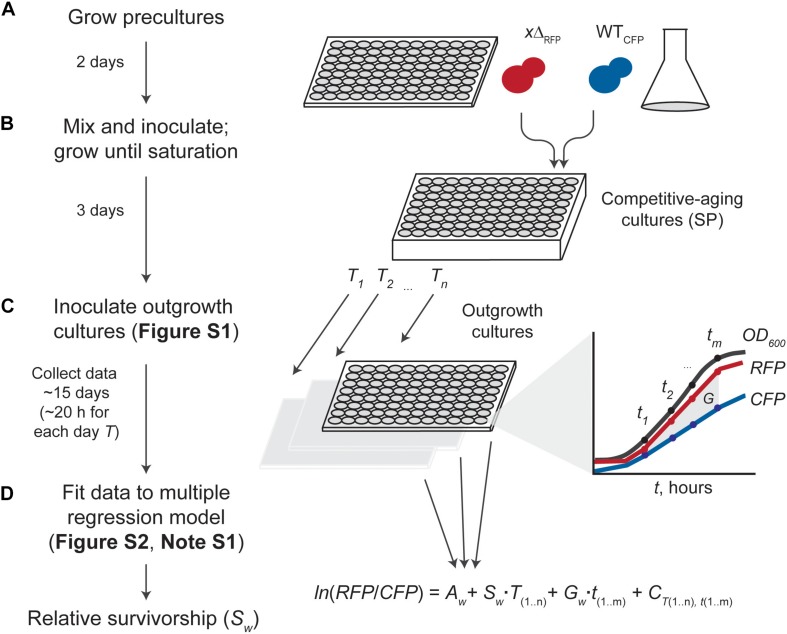
FIGURE 1.
Experimental and data-analysis workflow. (A) Starting cultures of fluorescence-tagged gene deletion (xΔRFP) and wild-type reference (WTCFP) are grown separately. (B) Saturated cultures are mixed (usually in a 1:2 WT/xΔ ratio for increased dynamic range) and inoculated into SC aging medium in a semi-deep well plate until stationary phase (SP). (C) Competitive-aging cultures are sampled regularly at days t; outgrowth cultures in fresh medium are monitored at T hours with simultaneous measurement of absorbance at 600 nm (OD600), and raw RFP and CFP signals (Supplementary Figure S1). Possible differences in growth rate (G) are taken into account. (D) Data analysis uses the change in fluorescent-signal ratio in the outgrowth cultures to estimate the relative survivorship of each mutant (Sw). Data is fitted to a multiple linear-regression model considering the change of ln(RFP/CFP) empirical measurements over time as a function of the starting strains’ proportion (A), the mutant’s relative growth rate (G), systematic batch errors in the measurements (C), and the mutant’s survivorship relative to the wild-type (G), our parameter of interest (Supplementary Figure S2 and Note S1).

