FIGURE 3.
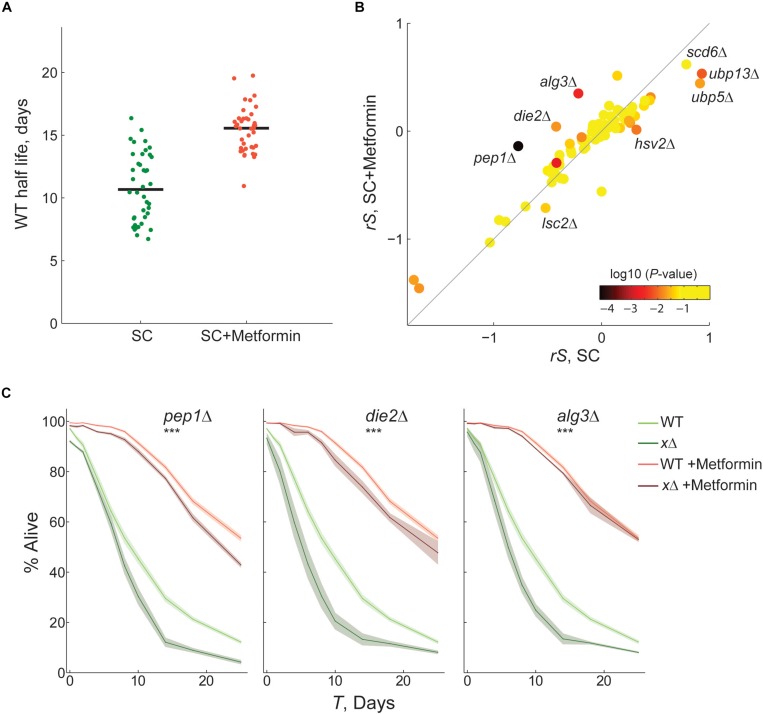
Identification of gene-drug interactions by competitive-aging screening. (A) Half life of WT-reference samples with (n = 39) or without metformin (n = 40). (B) Scatter plot comparing the CLS phenotypes of 76 gene-deletion strains with or without metformin; the average rescaled relative survivorship rS shown of four replicates is shown. Color scale indicates the p-value of paired t-tests between the S in SC and SC + Metformin. (C) Gene-drug interactions confirmed by live/dead staining. Survival curves of wild-type (light colors) and gene-deletion (dark colors) strains in nominal SC medium (green) or SC + metformin (orange); 95% CI were calculated from at least three replicates (shaded area). The interaction between metformin and gene-deletions was scored significant by two-way ANOVA tests of the death rates (***p < 0.01).

