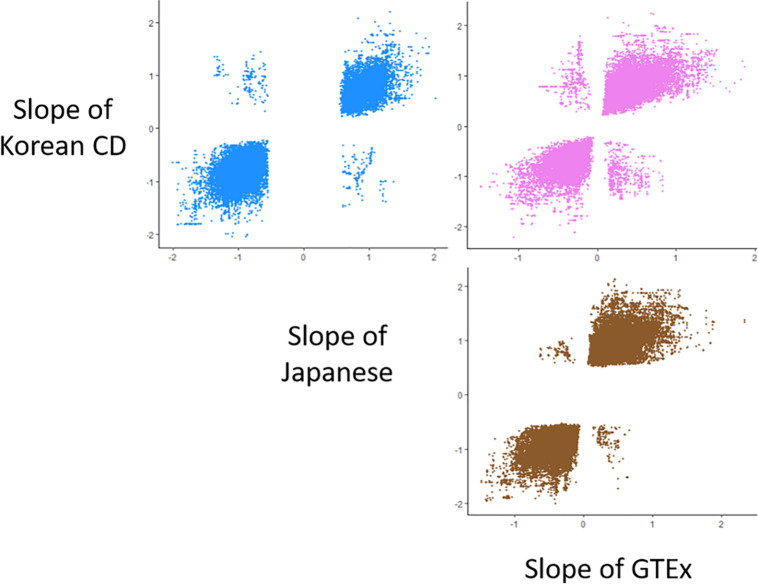
FIGURE 1.
Scatter plots for comparison of the direction of allelic effects among the whole blood cis-eQTL data from the Korean CD, Japanese samples, and GTEx project. Each point on the scatter plots represents the allelic effect of a SNP to a gene expression. The scatter plots included 50,848 cis-eQTLs of 1,201 eGenes between the Korean CD and Japanese samples, 58,197 cis-eQTLs of 1,581 eGenes between the Korean CD and GTEx, and 120,158 cis-eQTLs of 1,873 eGenes between the GTEx and Japanese samples.

