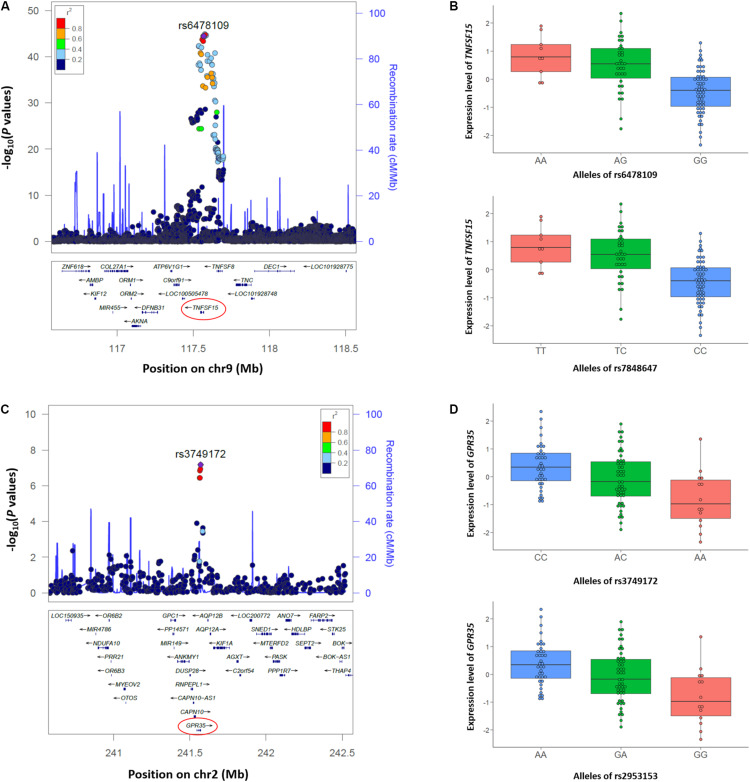
FIGURE 2.
Two loci including TNFSF15 and GPR35 identified with colocalization analysis between CD GWAS and cis-eQTL data from the Korean CD samples. (A,C) Regional association plots of the (A) TNFSF15 locus at 9q32 using 5,956 SNPs, and (C) GPR35 locus at 2q37 using 497 SNPs in ±1 Mb from rs6478109 and rs3749172 are plotted according to their chromosomal positions (hg19) with –log10 P values from the Korean CD GWAS. Both rs6478109 and rs3749172 are shown as purple circles in each plot. LD (r2) indicated with colors was calculated using East Asian population data (JPT + CHB) for the 1000 Genomes (http://www.internationalgenome.org). Regional association plots were generated using a web browser, LocusZoom (http://locuszoom.org/genform.php?type=yourdata). (B,D) Box plots of the (B) TNFSF15 expression level according to alleles of rs6478109 and rs7848647, and (D) GRP35 expression level according to alleles of rs3749172 and rs2953153. Small circles in the box plot indicate the normalized expression level using trimmed mean of M-values (TMM).

