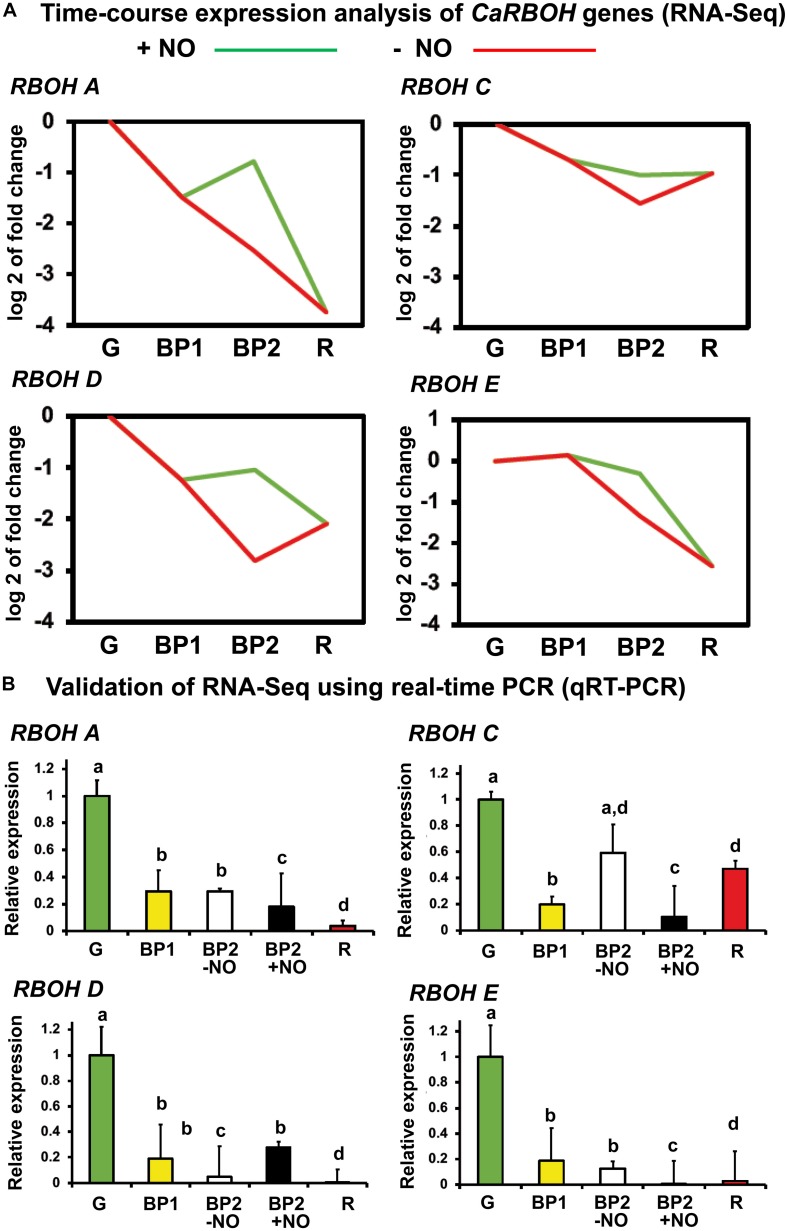
FIGURE 4.
(A) Time-course expression analysis of four CaRBOH genes (RNA-Seq). (B) Validation of RNA-Seq data using real-time quantitative PCR (RT-qPCR). Samples of sweet pepper fruits at different stages of ripening correspond to immature green (G), breaking point 1 (BP1), and breaking point 2 with and without NO treatment (BP2 + NO and BP2 – NO, respectively). Each PCR was performed at least three times, with three independent samples. Different letters indicate significant differences (P < 0.05).

