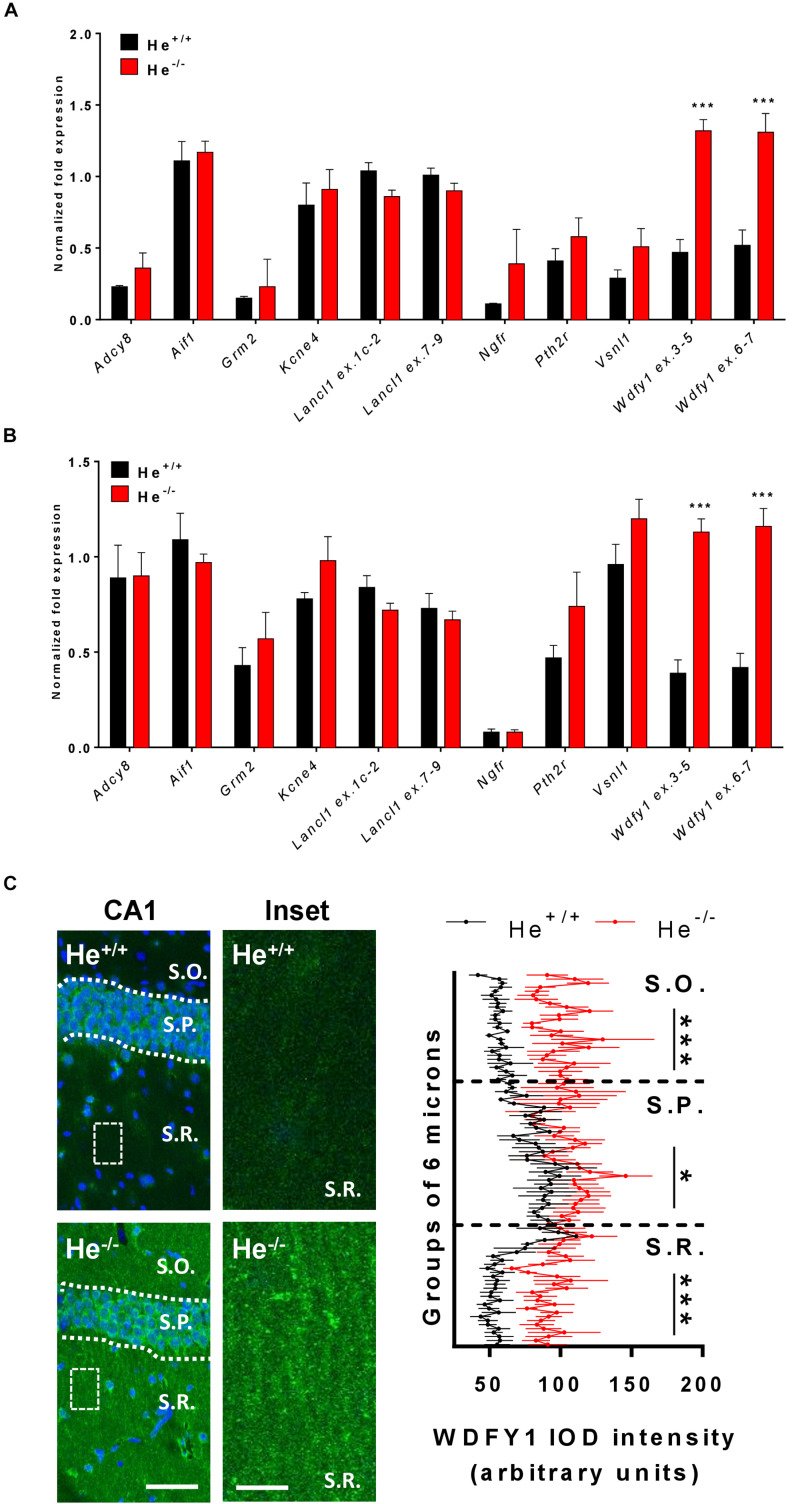
FIGURE 1.
WDFY1 protein and gene expression in He–/– mice. (A) mRNA levels of Adcy8, Aif1, Grm2, Kcne4, Lancl1 (two different probes: exons 1c-2 and exons 7–9), Ngfr, Pth2r, Vsnl1, and Wdfy1 (two different probes: exons 3–5 and exons 6–7) were determined in striatal samples of 8-week-old He+/+ and He–/– mice (n = 6 He+/+ and 6 He–/–; 3 males and 3 females per genotype). (B) mRNA levels of Adcy8, Aif1, Grm2, Kcne4, Lancl1 (two different probes: exons 1c-2 and exons 7–9), Ngfr, Pth2r, Vsnl1, and Wdfy1 (two different probes: exons 3–5 and exons 6–7) were determined in hippocampal samples of 8-week-old He+/+ and He–/– mice (n = 6/genotype). (C) Double staining for DAPI (blue) and WDFY1 (green) in the hippocampal CA1 of 8-week-old He+/+ and He–/– mice (left). White squares represent inset zones with their magnifications placed at right of each original CA1 image. Quantification (n = 2 He+/+ males and 2 He+/+ females, and 2 He–/– males and 3 He–/– females) of the intensity of the optical density (IOD) in the CA1 is shown separately for stratum oriens (S.O.), stratum pyramidale (S.P.), and stratum radiatum (S.R.). A linear intensity profile analysis as a mean IOD was performed in each image. Points in the X axis indicate mean IOD for each row of pixels. An independent statistical analysis was performed in each CA1 layer. Bars represent mean ± SEM. Data were analyzed by Student’s t-test for each gene in (A,B) and by two-way analysis of variance (ANOVA) in (C). In (A), ***p = 0.000106 and p = 0.0008 for Wdfy1 ex.3–5 and Wdfy1 ex.6–7 respectively when compared with He+/+ mice. In (B), ***p = 1,971446e-005 and p = 0.00018 for Wdfy1 ex.3–5 and Wdfy1 ex.6–7 respectively when compared with He+/+ mice. Scale bar, 70 (left images) and 10 μm (right images).

