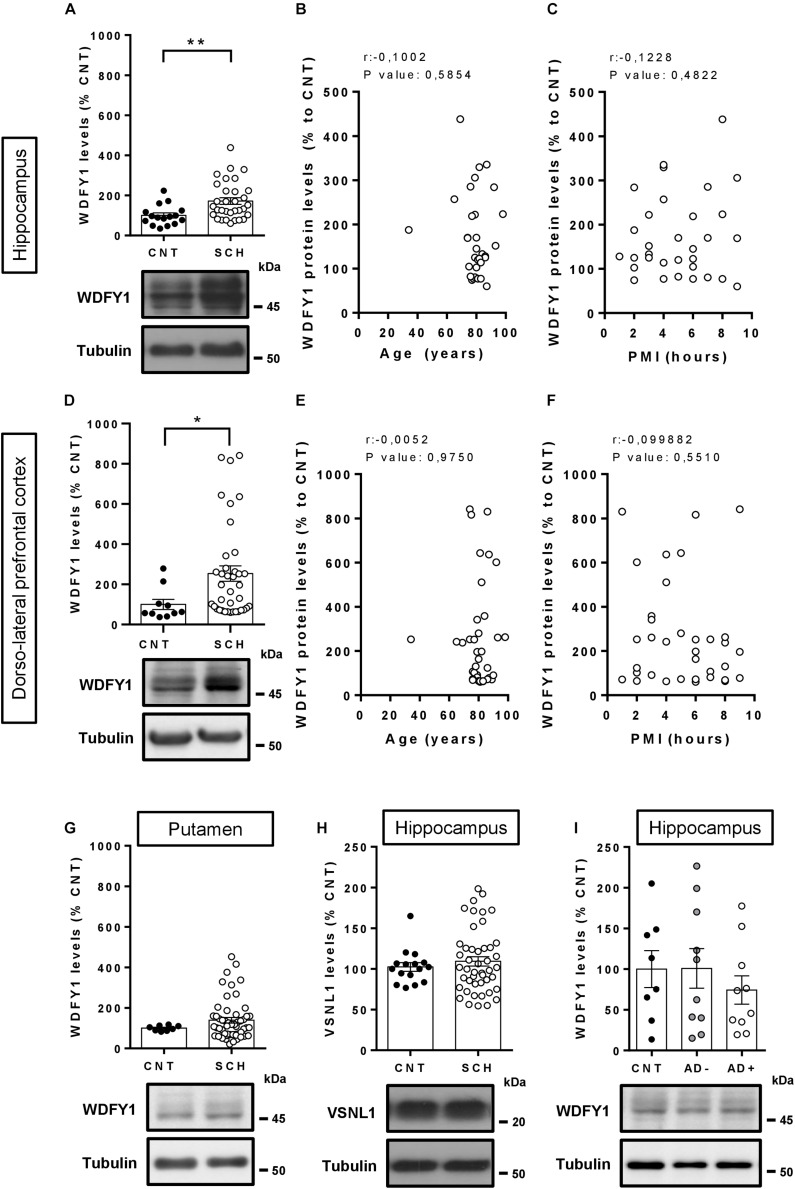
FIGURE 2.
WDFY1 protein levels in patients with schizophrenia and in patients with Alzheimer’s disease with or without psychosis. (A) Immunoblotting for WDFY1 and Tubulin as a loading control in the hippocampus of human post-mortem samples from patients with schizophrenia (SCH) and control (CNT) individuals (n = 16 CNT and 32 SCH). Correlation analysis comparing WDFY1 protein levels in schizophrenic patients from (A) with (B) age or (C) post-mortem interval (PMI). (D) Immunoblotting for WDFY1 and Tubulin as a loading control in the dorsolateral prefrontal cortex of human post-mortem samples from patients with schizophrenia and control individuals (n = 10 CNT and 38 SCH). Correlation analysis comparing WDFY1 protein levels in schizophrenic patients from (D) with (E) age or (F) post-mortem interval (PMI). (G) Immunoblotting for WDFY1 and Tubulin as a loading control in the putamen of human post-mortem samples from patients with schizophrenia and control individuals (n = 8 CNT and 53 SCH). (H) Immunoblotting for VSNL1 and Tubulin as a loading control in the hippocampus of human post-mortem samples from patients with schizophrenia and control individuals (n = 16 CNT and 46 SCH). (I) Immunoblotting for WDFY1 and Tubulin as a loading control in the hippocampus of human post-mortem samples from patients with Alzheimer’s disease with (AD +) or without (AD-) associated/diagnosed psychotic symptoms and control (CNT) individuals (n = 8 CNT, 10 AD-, and 10 AD+). Bars represent mean ± SEM. Data were analyzed by Student’s t-test in (A,D,G,H), by Pearson’s correlation coefficient in (B,C,E,F) and by one-way ANOVA in (I) with the Tukey’s test as a post hoc. *p = 0.049, **p = 0.0065 when compared with CNT.

