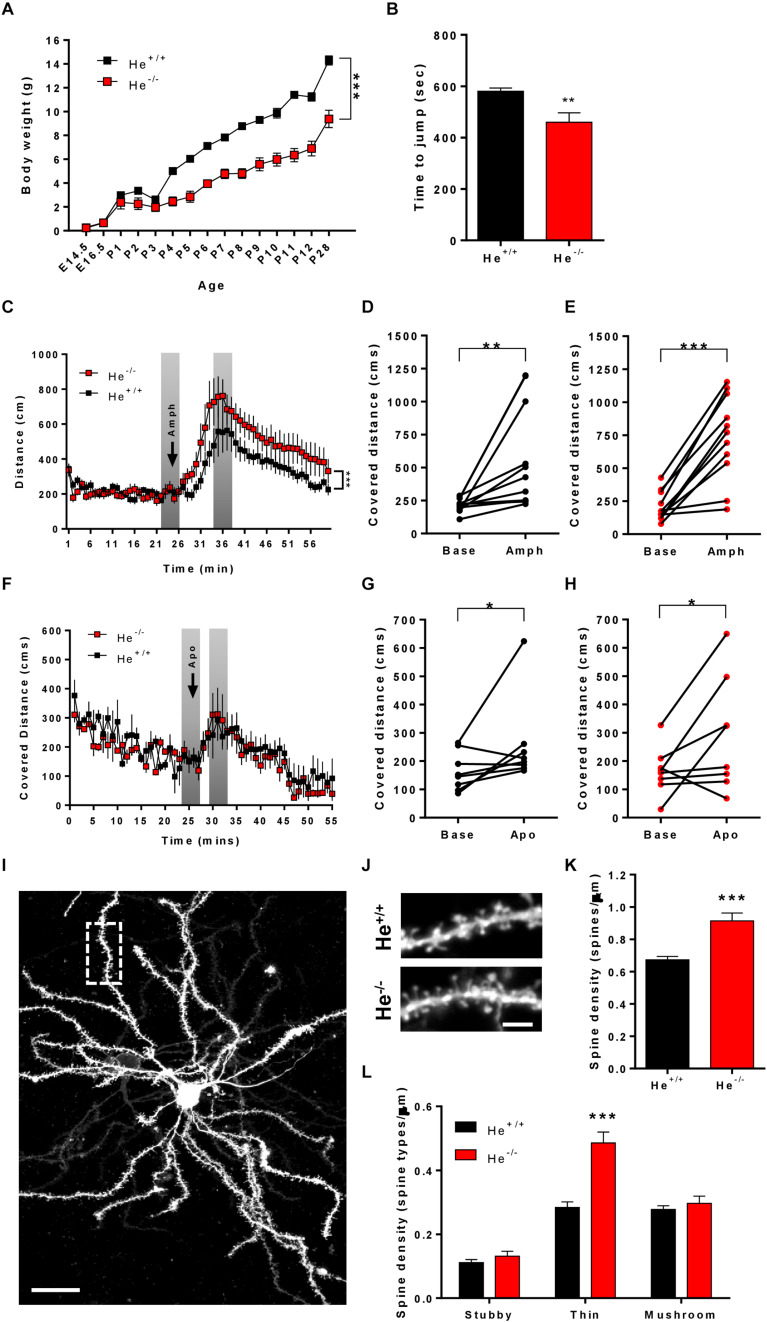
FIGURE 3.
Characterization of schizophrenia-like phenotypes related to striatal function in He–/– mice. (A) The curve in graph depicts the body weight gain in both genotypes, He–/– and He+/+ mice from embryonic day 14.5 (E14.5) to postnatal day 28 (P28) (n = 3 He+/+ males and 4 He+/+ females, and 4 He–/– males and 4 He–/– females). (B) Time to jump out from the glass cylinder in 8-week-old He–/– and He+/+ mice (n = 4 He+/+ males and 4 He+/+ females, and 3 He–/– males and 4 He–/– females). (C) Locomotor activity in the open field was monitored for 25 min in He–/– and He+/+ mice (n = 6 He+/+ males and 5 He+/+ females, and 5 He–/– males and 6 He–/– females). After these 25 min, all mice received an injection of D-amphetamine sulfate (3 mg/kg) as indicated by the top arrow in the graph and the locomotor activity was subsequently monitored for additional 45 min. The induced locomotor activation in He+/+ (D) and He–/– (E) mice was evaluated by comparing representative covered distances from baseline and from treatment as depicted in gray in (C). (F) Locomotor activity in the open field was monitored for 25 min in He–/– and He+/+ mice (n = 8 He+/+ and 8 He–/–; 4 males an 4 females per genotype). After these 25 min, all mice received an injection of R-(-)-apomorphine (0.5 mg/kg) as indicated by the top arrow in the graph and the locomotor activity was subsequently monitored for additional 45 min. The induced locomotor activation in He+/+ (G) and He–/– (H) mice was evaluated by comparing representative covered distances from baseline and from treatment as depicted in gray in (F). (I) Representative images of a DiI-labeled medium spiny neuron (scale bar = 20 microns) and (J) representative medium spiny neuron dendrites from 8-weeks-old He+/+ and He–/– mice (scale bar = 3 microns). (K) Quantitative analysis showing dendritic spine density per micron of dendritic length from 8-week-old He+/+ and He–/– mice (n = 26 dendrites from 5 He+/+ mice, 2 males and 3 females, and 20 dendrites from 5 He–/– mice, 3 males and 2 females). (L) Density of each type of dendritic spine (stubby, thin, and mushroom) in dendrites of medium spiny neurons from (K) in He–/– and He+/+ mice. Total evaluated spines: 977 from He+/+ mice and 1088 from He–/– mice. Bars represent mean ± SEM. Data were analyzed by unpaired Student’s t-test in (B,K), by paired Student’s t-test in (D,E,G,H) and by two-way ANOVA in (A,C,F,L). **p < 0.01, ***p < 0.001 when compared with He+/+ mice in (A–C,F,K,L). *p < 0.05, **p < 0.01 when compared with baseline data in (D,E,G,H).

