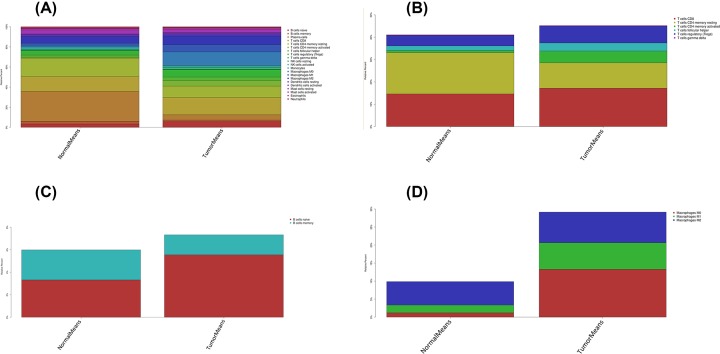
Figure 3. The distribution of 22 immune cell infilteration between GC adjacent tissues and tumor tissues.
The stacked histogram shows the distribution of 22 immune cell infiltration between GC adjacent tissues and tumor tissues, including total immune cells (A), total T cells (B), total B cells (C) and total macrophages (D).

