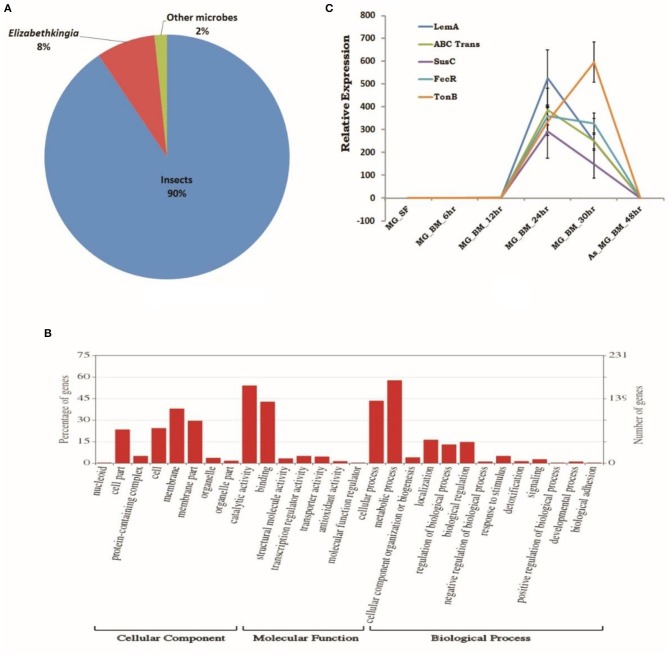
Figure 6.
RNAseq identified microbial transcripts signatures. (A) Pie chart showing species distribution analysis of gut RNAseq data identifying transcripts having BLASTX homology to Insects (90%), Elizabethkingia as dominant gut endosymbiont bacteria (8%), and other microbes (2%); (B) molecular catalog of identified EK transcripts; and (C) transcriptional profiling of bacterial EK specific transcripts in response to blood meal.

