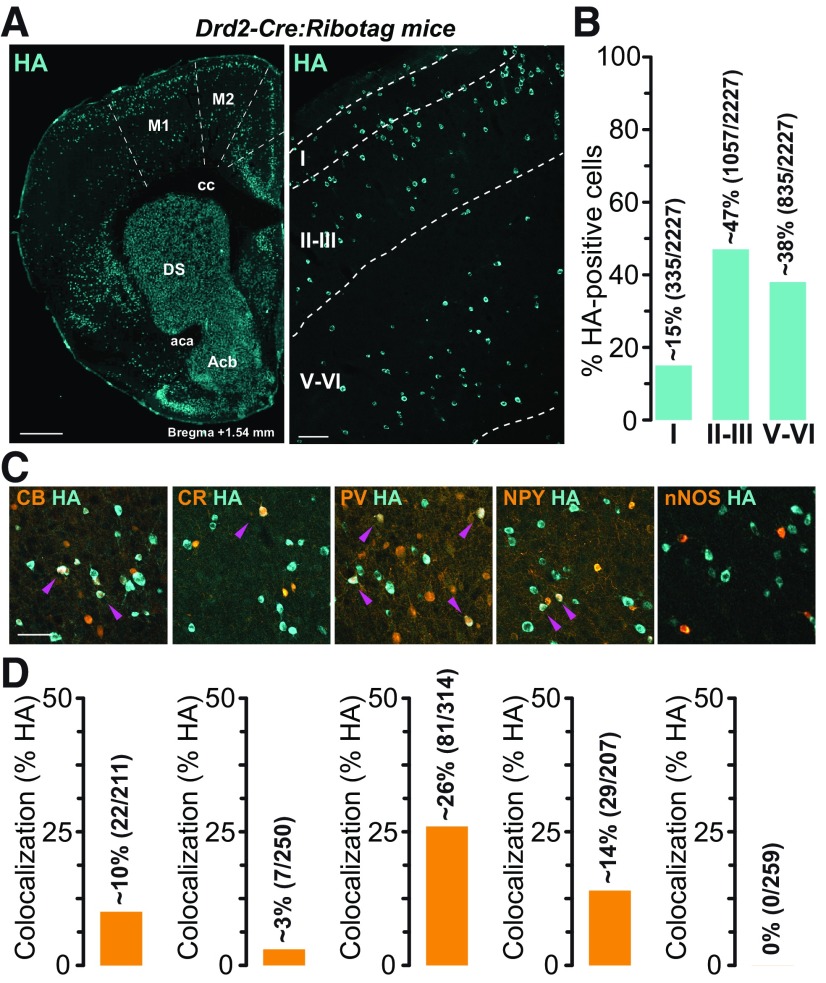
Figure 1.
Distribution of D2R-expressing neurons in M1 in Drd2-Cre:Ribotag mice. A, Coronal section from Drd2-Cre:Ribotag mice stained with hemagglutinin (HA) showing the distribution of D2R-expressing neurons in the different layers of M1. Scale bars: 500 μm (left) and 50 μm (right). B, Histogram showing the distribution of HA-labeled neurons in Layer I, Layers II–III, and Layers V–VI of the M1 (17 hemispheres analyzed, 5 mice). The distribution is expressed as a percentage of HA-positive neurons in all layers. The number of HA-positive cells counted is indicated between parentheses. C, HA (cyan) and calbindin-D28k (CB), Calretinin (CR), parvalbumin (PV), neuropeptide Y (NPY), and nNOS (orange) immunofluorescence in M1 Layers V–VI of Drd2-Cre:Ribotag mice. Magenta arrowheads indicate HA/markers-positive neurons. Scale bars: 40 μm. D, Histograms showing the co-expression as a percentage of HA-positive cells in M1 Layers V–VI of Drd2-Cre:Ribotag mice (blue, left). The total numbers of HA- and marker-positive cells counted are indicated between parentheses. DS: dorsal striatum; cc: corpus callosum; Acb: nucleus accumbens; aca: anterior commissure.

