Fig. 1.
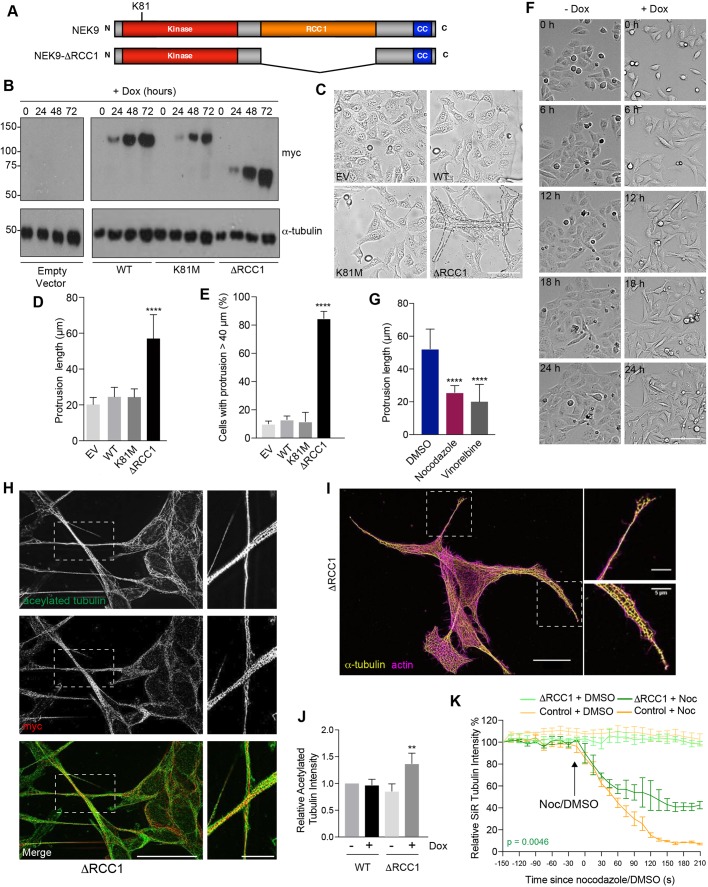
Constitutively active NEK9 induces altered morphology and stabilized microtubules in interphase cells. (A) Schematic representation of full-length and activated NEK9, showing the kinase, RCC1 and coiled-coil (CC) domains. The position of the inactivating K81M mutation is indicated. (B) U2OS stable cell lines were induced (+Dox) to express wild-type (WT), catalytically inactive (K81M) or constitutively active (ΔRCC1) myc–NEK9 for 0, 24, 48 and 72 h. Lysates were prepared and analysed by western blotting with myc and α-tubulin antibodies. U2OS cells with the tetracycline-inducible plasmid (empty vector, EV) were used as a negative control. Blots shown are representative of n=3 experiments. (C) Phase-contrast images of cells as described in B that were induced to express NEK9 proteins for 48 h prior to imaging. Scale bar: 50 µm. (D) The maximum length of cytoplasmic protrusions for cells as prepared in C is indicated. (E) The percentage of cells with protrusions exceeding 40 µm for cells as prepared in C is indicated. (F) Still images from time-lapse phase-contrast imaging of U2OS:myc–NEK9 ΔRCC1 cells with or without doxycycline for the times indicated. Scale bar: 100 µm. Images are representative of n=3 experiments. (G) Dox-induced U2OS:myc–NEK9 ΔRCC1 cells were treated with DMSO, nocodazole or vinorelbine then analysed by phase-contrast microscopy. The maximum length of cytoplasmic protrusions measured is shown. (H) U2OS:myc–NEK9 ΔRCC1 cells were analysed by immunofluorescence microscopy with myc and acetylated tubulin antibodies. Images reconstructed using SRRF analysis are shown. Images are representative of n=3 experiments. (I) U2OS:myc–NEK9 ΔRCC1 cells were analysed by immunofluorescence microscopy with α-tubulin antibodies while actin was stained with phalloidin–FITC. Images reconstructed using SRRF analysis are shown. Images are representative of n=3 experiments. In H and I, magnified views of cytoplasmic protrusions are shown on the right. The locations of the magnified views are indicated by boxed regions in the images on the left. Scale bars: 20 µm (main images) and 5 µm (magnified views). (J) Cell lysates prepared from U2OS:myc–NEK9 WT and ΔRCC1 cells were western blotted with acetylated tubulin and GAPDH antibodies. The intensity of acetylated tubulin relative to GAPDH is indicated. (K) U2OS:myc–NEK9 WT and ΔRCC1 cells were incubated with SiR-Tubulin. Measured SiR-Tubulin intensity before and after addition of nocodazole or DMSO (arrow) is shown.

