Fig. 2.
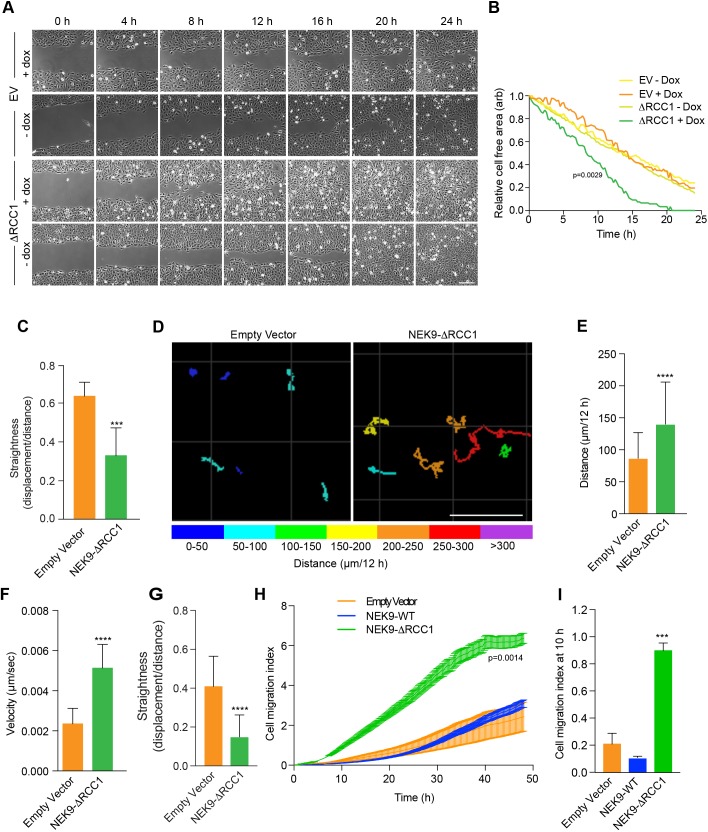
Activated NEK9 increases cell migration. (A) U2OS:myc–NEK9–ΔRCC1 or EV (empty vector) cells with or without dox induction were imaged to observe closure of a scratch wound. Representative images at time-points indicated are shown (n=3 experiments). Scale bar: 200 µm. (B) Rates of wound closure for cells imaged as described in A are shown. Data are representative of n=3 experiments. (C) The persistence of movement for cells at the leading edge of wounds generated as in A, as measured by quantifying track straightness for each cell. (D) U2OS:myc–NEK9 ΔRCC1 or EV were induced for 24 h, transfected with YFP for 24 h and subsequently imaged by time-lapse microscopy. Movement of individual cells was tracked over a 12 h period by following the position of the YFP signal. The total distance travelled is shown, colour-coded as indicated (µm). Scale bar: 100 µm. (E) The mean distance travelled by cells treated as in D is shown. (F) The mean velocity of cells treated as in D is indicated. (G) The persistence of movement for cells treated as in D as measured by quantifying track straightness (track displacement/track length) for each cell. (H) U2OS:myc–NEK9 WT, ΔRCC1 or EV were induced for 24 h before being starved in serum-free medium for a further 24 h, and seeded in RTCA CIM-16 plates. Complete medium containing 10% FBS was used as a chemoattractant and impedance measurements were used to determine cell migration in real time. The cell migration index over the course of the assay is shown. (I) The histogram shows the cell migration index at 10 h from RTCA assays as presented in H.

