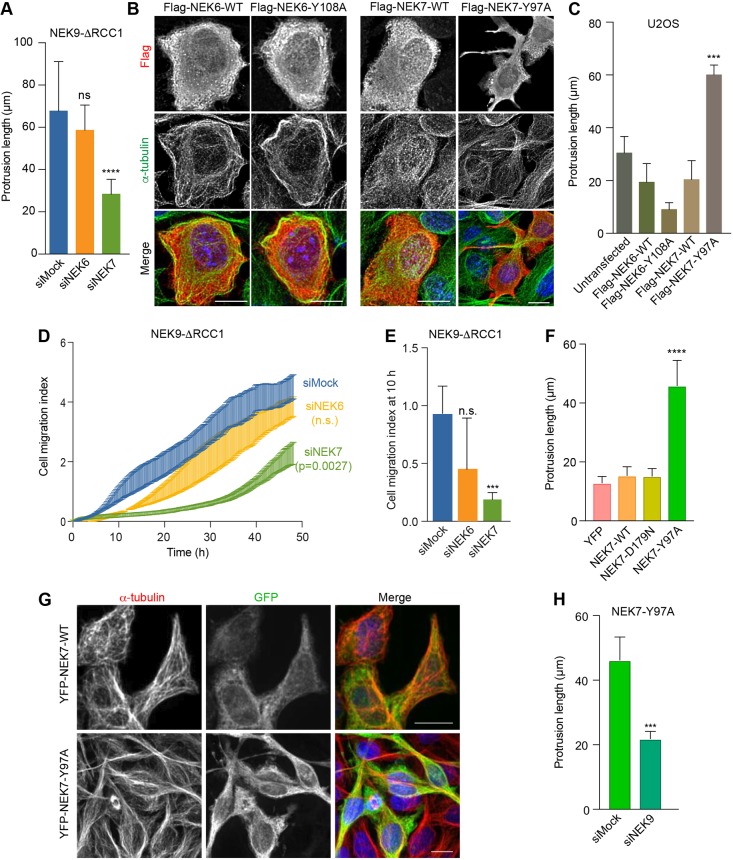
Fig. 3.
NEK9-induced alterations in cell morphology and migration are dependent on NEK7. (A) U2OS:myc–NEK9–ΔRCC1 cells were depleted as indicated. Cells were processed for immunofluorescence microscopy and the maximum lengths of interphase cytoplasmic protrusions measured are shown. (B) U2OS cells were transiently transfected with wild type (WT) or constitutively active FLAG–NEK6 (Y108A) or FLAG–NEK7 (Y97A), as indicated, before being processed for immunofluorescence microscopy with FLAG (green) and α-tubulin (red) antibodies. DNA (blue) was stained with Hoechst 33258. Scale bars: 10 µm. Images shown are representative of n=3 experiments. (C) The maximum length of interphase cytoplasmic protrusions for cells as described in B. (D) U2OS:myc–NEK9–ΔRCC1 cells were depleted as indicated, and cell migration was analysed in real time as described in Fig. 2H. Cell migration index over the course of the assay is shown. (E) Cell migration index at 10 h from the RTCA assays as shown in D. (F) HeLa:YFP, or YFP–NEK7 WT, D179N or Y97A cells were processed for immunofluorescence microscopy. The maximum length of interphase cytoplasmic protrusion is shown. (G) HeLa:YFP–NEK7 WT and Y97A cells were analysed by immunofluorescence microscopy with GFP (green) and α-tubulin (red) antibodies. Scale bars: 20 µm. Images shown are representative of n=3 experiments. (H) HeLa:YFP–NEK7 Y97A were depleted as indicated and cells were processed for immunofluorescence microscopy. The maximum length of interphase cytoplasmic protrusions measured is shown.

