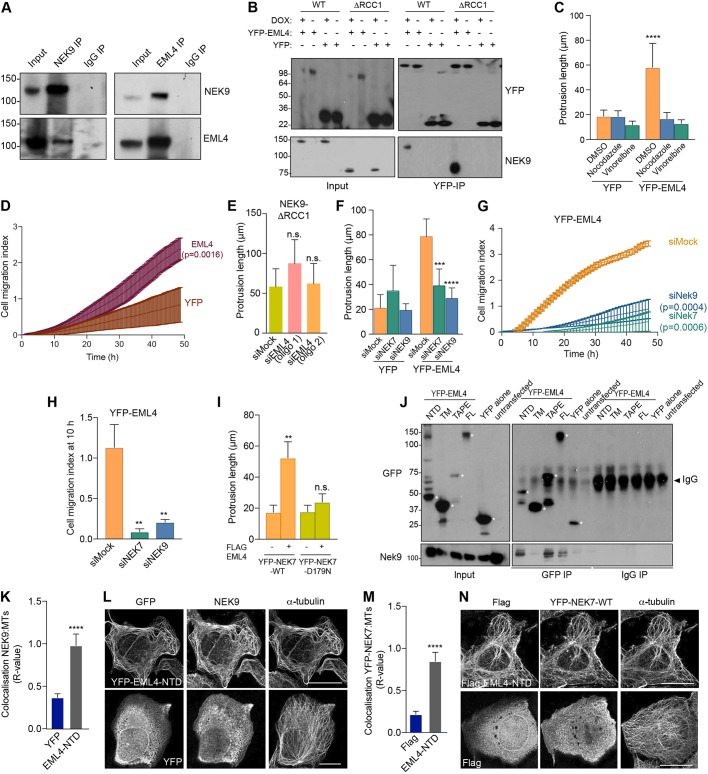
Fig. 4.
EML4 induces NEK9-dependent changes in cell morphology and migration, and recruits NEK9 and NEK7 to interphase microtubules. (A) U2OS cell lysates (inputs) and immunoprecipitates (IP) were prepared with rabbit NEK9, EML4 and control IgGs and analysed by western blotting with the indicated antibodies. (B) U2OS:myc–NEK9–WT or ΔRCC1 cells were transfected with YFP–EML4 or YFP alone. Lysates (input) and immunoprecipitates (IP) were prepared with GFP antibodies and analysed by western blotting with the indicated antibodies. (C) U2OS:YFP or U2OS:YFP–EML4 cell lines were treated as indicated for 16 h before analysis by phase-contrast microscopy. The maximum length of interphase cytoplasmic protrusions measured is shown. (D) Cell migration of U2OS:YFP or U2OS YFP–EML4 cells was analysed in real time as in Fig. 2H. The cell migration index over the course of the assay is shown. (E) U2OS:myc–NEK9–ΔRCC1 were depleted with mock or two different siRNAs against EML4. The maximum length of interphase cytoplasmic protrusion is shown. (F) U2OS:YFP or U2OS:YFP–EML4 cells were depleted as indicated before being analysed by phase-contrast microscopy. The maximum length of interphase cytoplasmic protrusion is shown. (G) U2OS:YFP–EML4 cells were depleted as indicated and cell migration was analysed in real time as in Fig. 2H. The cell migration index over the course of the assay is shown. (H) Cell migration index at 10 h from the data in G. (I) HeLa:YFP–NEK7 WT or D179N were transfected with FLAG–EML4 for 24 h. The maximum length of cytoplasmic protrusion for transfected cells is shown. (J) U2OS cells were transfected with YFP–EML4 full length (FL), TM (trimerization motif), TAPE domain, NTD domain or YFP alone for 24 h. Lysates (inputs) and immunoprecipitates (IP) were prepared with GFP and control IgGs and analysed by western blotting with the antibodies indicated. Asterisks indicate the proteins of interest. (K) U2OS cells were transfected with YFP alone or YFP–EML4 NTD before being processed for immunofluorescence microscopy with antibodies against GFP, NEK9 and α-tubulin. Colocalization between the Nek9 and α-tubulin signals is shown. (L) Representative images of cells analysed in K. Scale bars: 10 µm. (M) HeLa:YFP–NEK7 cells were transfected with FLAG alone or FLAG–EML4 NTD for 24 h. Cells were processed for immunofluorescence microscopy with antibodies against FLAG, GFP and α-tubulin. Colocalization between the YFP–NEK7 fluorescence and α-tubulin signals is shown. (N) Representative images of cells analysed in M. Scale bars: 10 µm. R values in K and M show the mean±s.d. Pearson's correlation coefficient from five lines per cell in ten cells taken from a total of n=3 experiments. Blots shown in A, B and J are representative of n=3 experiments.

