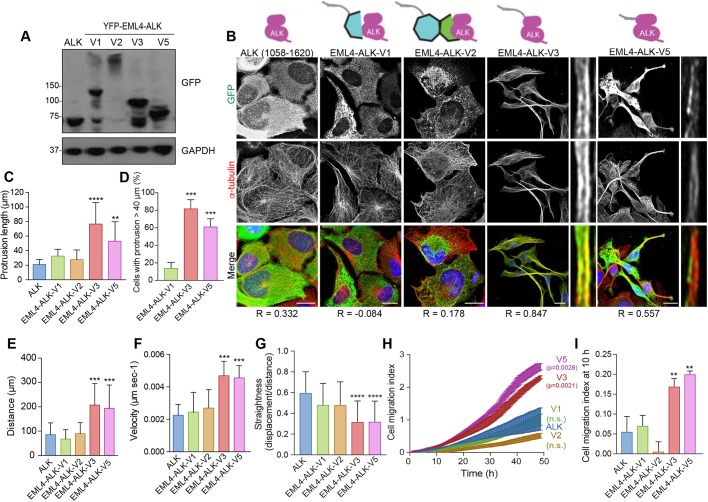
Fig. 5.
EML4–ALK variants that bind microtubules alter cell morphology and migration. (A) U2OS cell lines stably expressing YFP-tagged EML4–ALK fusion variants were lysed and analysed by western blotting with antibodies indicated. Blots shown are representative of n=3 experiments. (B) U2OS stable cell lines expressing YFP-tagged proteins as in A were analysed by immunofluorescence microscopy with antibodies against GFP (green) and α-tubulin (red). DNA (blue) was stained with Hoechst 33258. Magnified views of individual microtubules are shown on the right of V3 and V5 images shown on the left. Schematic diagrams of the YFP-tagged proteins and the Pearson's correlation coefficient (R; mean of five lines per cell in ten cells from n=3 experiments) of colocalization with microtubules are shown. Scale bars: 10 µm. (C) The maximum length of interphase cytoplasmic protrusions for cells treated as in B. (D) The percentage of cells from C with protrusions greater than 40 µm is shown. (E) Individual cell tracking experiments were undertaken with YFP-tagged EML4–ALK variant cell lines and analysed as in Fig. 2D. The mean distance travelled is indicated. (F) As for E, but showing mean velocity of movement. (G) As for E but showing track straightness. (H) Migration of YFP-tagged EML4–ALK variant cell lines was analysed in real time as in Fig. 2H. The cell migration index over the course of the assay is shown. (I) The cell migration index at 10 h from the data in H.

