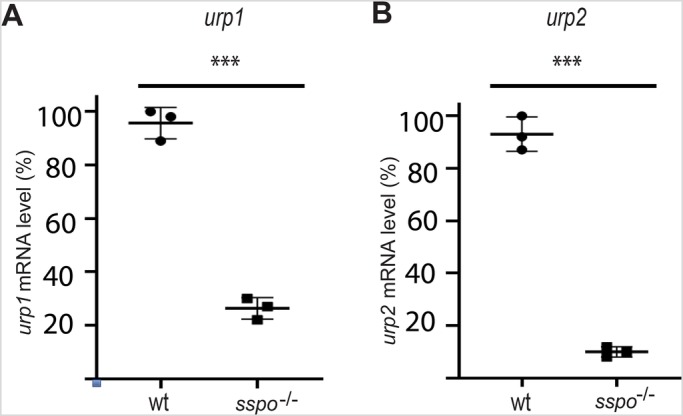
Fig. 4.

RT-qPCR analysis of urp1 and urp2 expression in wild-type and sspo mutants. (A) Expression level of urp1 mRNA is reduced in sspo mutants relative to wild type. ***P=0.0004 [three independent experiments; for each experiment, mRNA from wild-type and sspo mutants was extracted from a pool of eight embryos (at 26 hpf) per genotype]. (B) Expression level of urp2 is drastically reduced in sspo mutants relative to wild type. ***P=0.0001 (three independent experiments, for each experiment mRNA from wild-type and sspo mutants was extracted from a pool of eight embryos per genotype). Expression levels are plotted along the y-axis. The results were analysed using unpaired Student's t-test. Error bars represent standard deviation. Wt signifies mixture of wild-type and heterozygous siblings.
