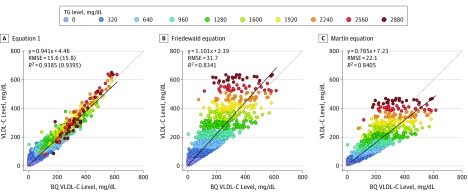
Figure 1. Calculated vs β-Quantification (BQ) Very Low-Density Lipoprotein Cholesterol (VLDL-C) Levels.
A, VLDL-C was calculated and plotted against VLDL-C as measured by BQ for Equation 1. B, VLDL-C was calculated and plotted against VLDL-C as measured by BQ for the Friedewald equation. C, VLDL-C was calculated and plotted against VLDL-C as measured by BQ for the Martin equation. The dotted line represents the line of identity, and the solid line is the linear fit for the indicated regression equation. Root mean square error (RMSE) and correlation coefficient (R2) values are from the validation data set (n = 9358), whereas the numbers in parentheses are corresponding values from the training set (n = 9357). The points on the graphs indicating the individual samples are color-coded according to triglyceride (TG) level. The color number scale for individual points indicates the start of the interval. To convert TGs to millimoles per liter, multiply by 0.0113; and to convert VLDL-C to millimoles per liter, multiply by 0.0259.

