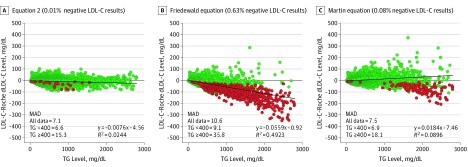
Figure 3. Residual Error Plots for Low-Density Lipoprotein Cholesterol (LDL-C) by Various Equations.
A, Difference between calculated LDL-C and direct LDL-C (dLDL-C) results (Roche; n = 174 179) for patients from a major reference laboratory is shown for Equation 2 plotted against triglyceride (TG) level. B, Difference between calculated LDL-C and dLDL-C results for patients from a major reference laboratory is shown for the Friedewald equation plotted against TG level. C, Difference between calculated LDL-C and dLDL-C results for patients from a major reference laboratory is shown for the Martin equation plotted against TG levels. Negative LDL-C test results are shown as red dots, placed on top of nonnegative test results (green dots), and hence make it appear that they are more abundant. The exact percentage of negative LDL-C test results are indicated for each panel. The mean absolute deviation (MAD) for all indicated equations is shown in each panel for each data set for TG levels less than 400 mg/dL or 400 mg/dL or higher. To convert LDL-C to millimoles per liter, multiply by 0.0259; and to convert TGs to millimoles per liter, multiply by 0.0113.

