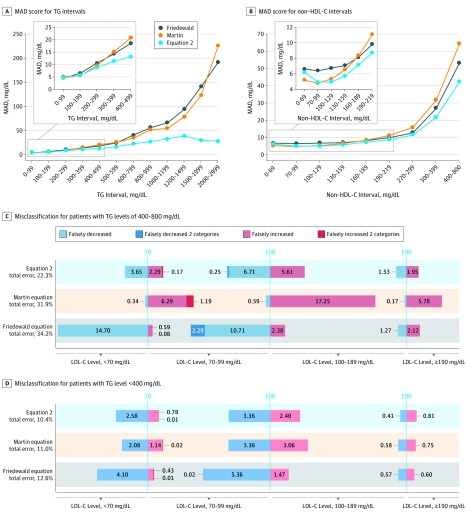
Figure 4. Test Accuracy and Classification of Patients Into Low-Density Lipoprotein Cholesterol (LDL-C) Treatment Categories.
A, Mean absolute deviation (MAD) score for LDL-C from a general population with dyslipidemia (n = 27 646) is shown for Equation 2 (blue line), the Friedewald equation (gray line), and the Martin equation (orange line) for the indicated triglyceride (TG) intervals. The inset shows a close-up for low TG samples. B, MAD score is shown for Equation 2 (blue line), the Friedewald equation (gray line), and the Martin equation (orange line) for the indicated non–high-density lipoprotein cholesterol (HDL-C) intervals. The inset shows a close-up for low non–HDL-C samples. C, Misclassification at the 3 LDL-C treatment thresholds (70, 100, and 190 mg/dL) for the 3 LDL-C equations is shown for patients with TG levels from 400 to 800 mg/dL (n = 1177). D, Misclassification at the 3 LDL-C treatment thresholds (70, 100, and 190 mg/dL) for the 3 LDL-C equations is shown for patients with TG levels less than 400 mg/dL (n = 26 312). Blue bars indicate patients misclassified into the lower LDL-C treatment category in which the bar is plotted. Red bars indicate patients misclassified into the higher LDL-C treatment category in which the bar is plotted. Darker blue and red bars indicate misclassifications that crossed more than 1 LDL-C treatment category. The numbers in the bars indicate the percentage of total patients misclassified and are proportional to the bar length. To convert LDL-C and non–HDL-C to millimoles per liter, multiply by 0.0259; and to convert TGs to millimoles per liter, multiply by 0.0113.

