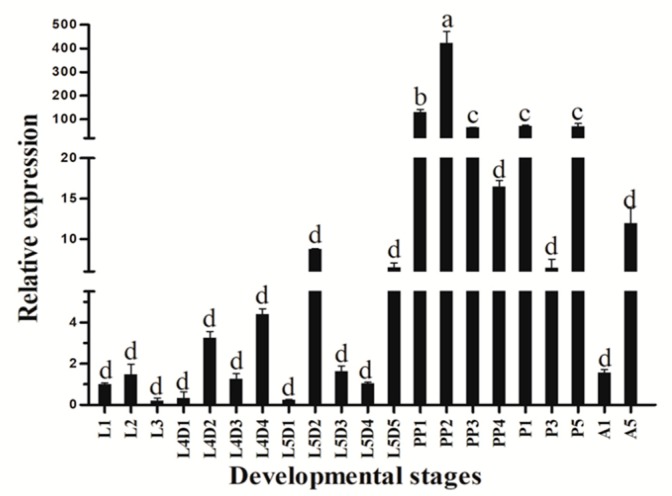
Figure 2.
Relative expression levels of HvATG8 at different stages: L1–L3, first- to third-instar larvae; L4D1–L4D4, 1-day-old fourth-instar larvae to 4-day-old fourth-instar larvae; L5D1–L5D5, 1-day-old fifth-instar larvae to 5-day-old fifth-instar larvae; PP1–PP4, 1-day-old to 4-day-old prepupae; P1, 1-day-old pupae; P3, 3-day-old pupae; P5, 5-day-old pupae; A1, 1-day-old adults; and A5, 5-day-old adults. Its expression levels at each developmental stage were normalized relative to that at L1. Error bars represent mean ± standard error of three biological replicates. Different letters above error bars indicate significant differences (p<0.05) based on one-way analysis of variance and Tukey’s test.

