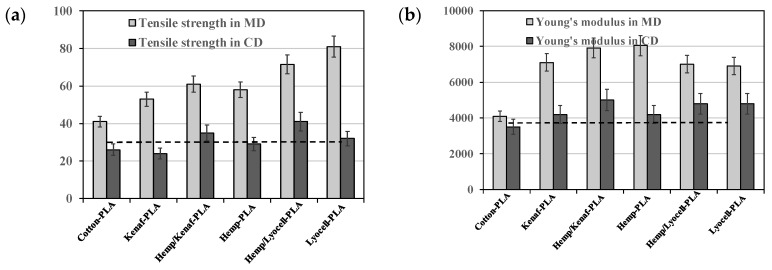
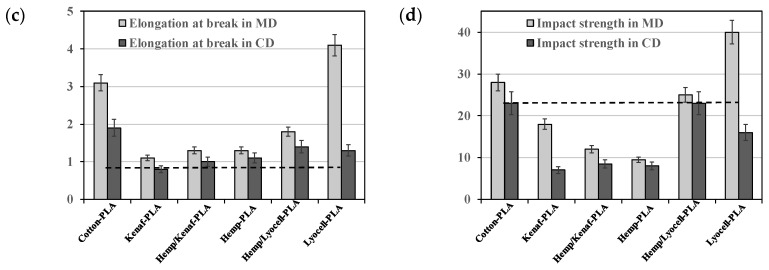
Figure 13.
Mechanical properties: (a) Tensile strength, (b)Young’s modulus, (c) elongation at break, and (d) Charpy impact strength of the composites and neat PLA (MD—machine direction; CD—cross direction; standard deviation are shown as error bars; the letter in the figures a, b, c, d, and e means that there are significant differences between the mean values measured in MD) [67], Reproduced with permission from Graupner N, Composites: Part A; published by Elsevier, 2009.


