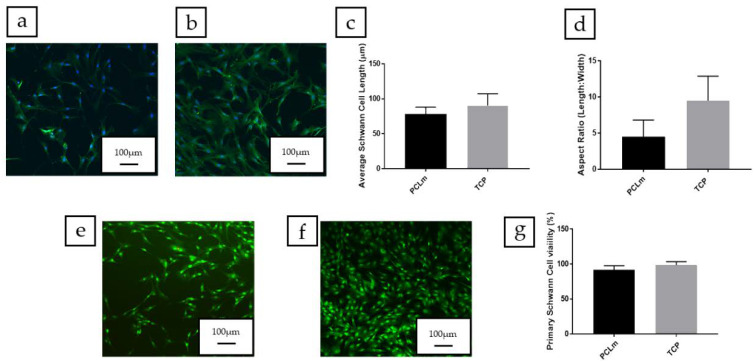
Figure 13.
Confocal micrographs of rat primary Schwann cells cultured on (a) PCLm films and (b) TCP control labelled for S100β (green) and DAPI (blue) (Scale bar = 100 µm). The images were quantified to determine (c) the average Schwann cell length and (d) the aspect ratio of Schwann cells per condition (mean ± SD, n = 3 independent experiments). Confocal micrographs of Schwann cells cultured on (e) PCLm film and (f) TCP controls labelled for Syto-9 (green) and propidium iodide (red) for live/dead analysis (scale bar = 100 µm). The images were quantified to determine the cell viability as a percentage of live versus dead cells (g) (mean ± SD, n = 3 independent experiments).

