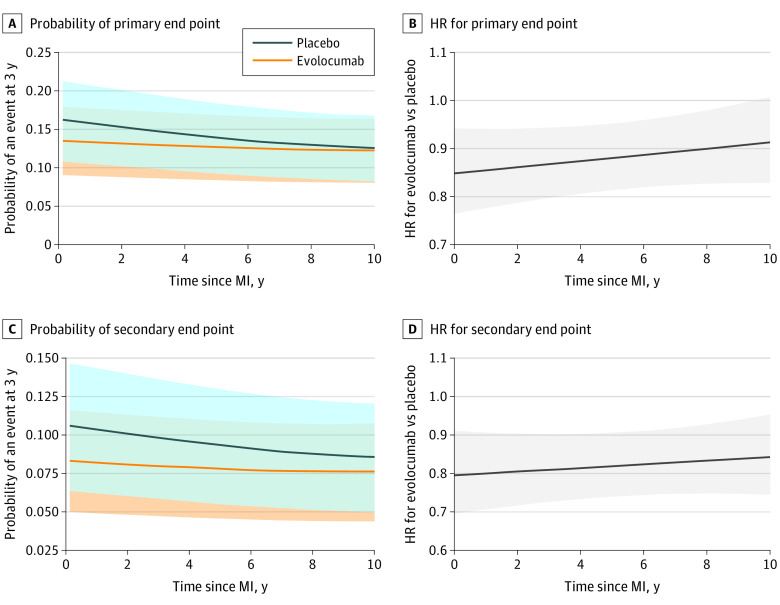
Figure 3. Probability of an Event at 3 Years for the Primary and Key Secondary End Points and Hazard Ratio (HR) of Evolocumab vs Placebo for the Primary and Key Secondary End Points by Time Since Prior Myocardial Infarction (MI).
A, Probability of the primary end point at 3 years among patients randomized to evolocumab vs placebo by time since MI. B, Hazard ratios for evolocumab vs placebo for the primary end point by time since MI. C, Probability of the key secondary end point at 3 years among patients randomized to evolocumab vs placebo by time since MI. D, Hazard ratios for evolocumab vs placebo for the key secondary end point by time since MI. Event rates were generated using cubic splines. Hazard ratios were estimated by Cox model, which included treatment (categorical variable), time from prior MI (continuous variable), and the interaction of treatment and time from prior MI. The analysis was restricted to patients with a prior MI date up to 10 years owing to sparse data beyond that time frame. The shaded areas indicate 95% CIs.

