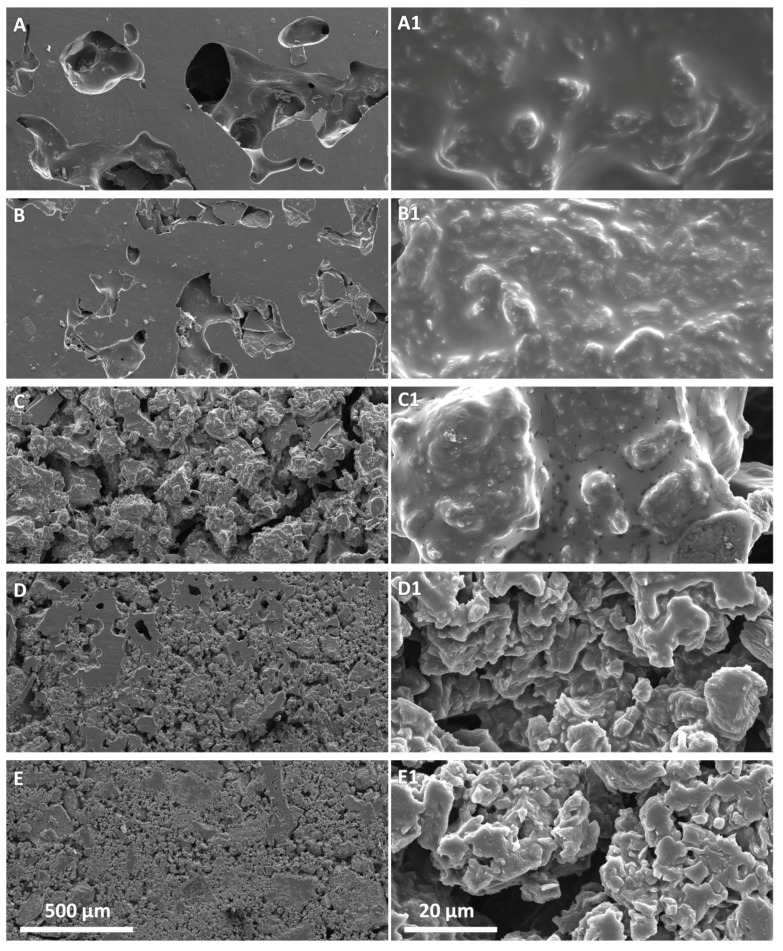
Figure 5.
Scanning Electron Microscopy (SEM) micrographs at different magnification of the nanocomposite composed by PK30-Gly-Gly and lrGO at different weight percentage. (A,A1) 4 wt. %, (B,B1) 5 wt. %, (C,C1) 6 wt. %, (D,D1) 7 wt. %, and (E,E1) 8 wt. %. Left pictures scale bar 500 μm, right pictures scale bar 20 μm.

