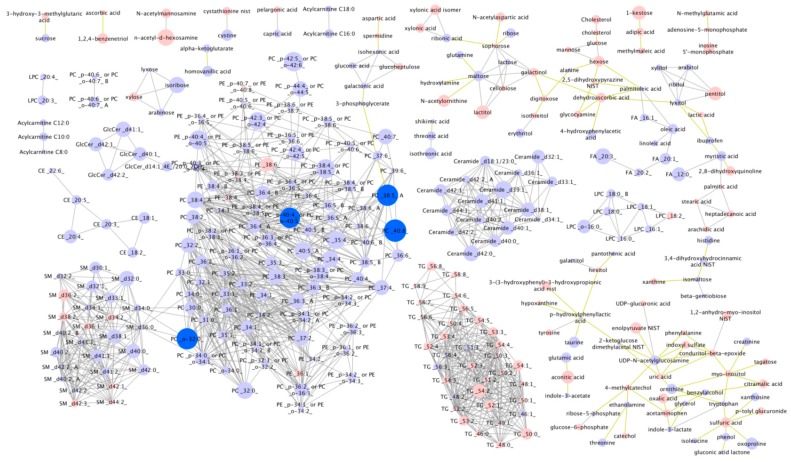
Figure 2.
Individual post-race metabolite levels according to 161-km race finish time. Dark blue = higher in faster finishers (FDR < 0.05). Light blue = non-significantly higher in faster finishers. Pink = non-significantly lower in faster runners. Node size reflects the magnitude of the correlation using the correlation coefficient. Linear distances between objects are calculated using the Tanimoto or KEGG coefficients (tests of structural similarity).

