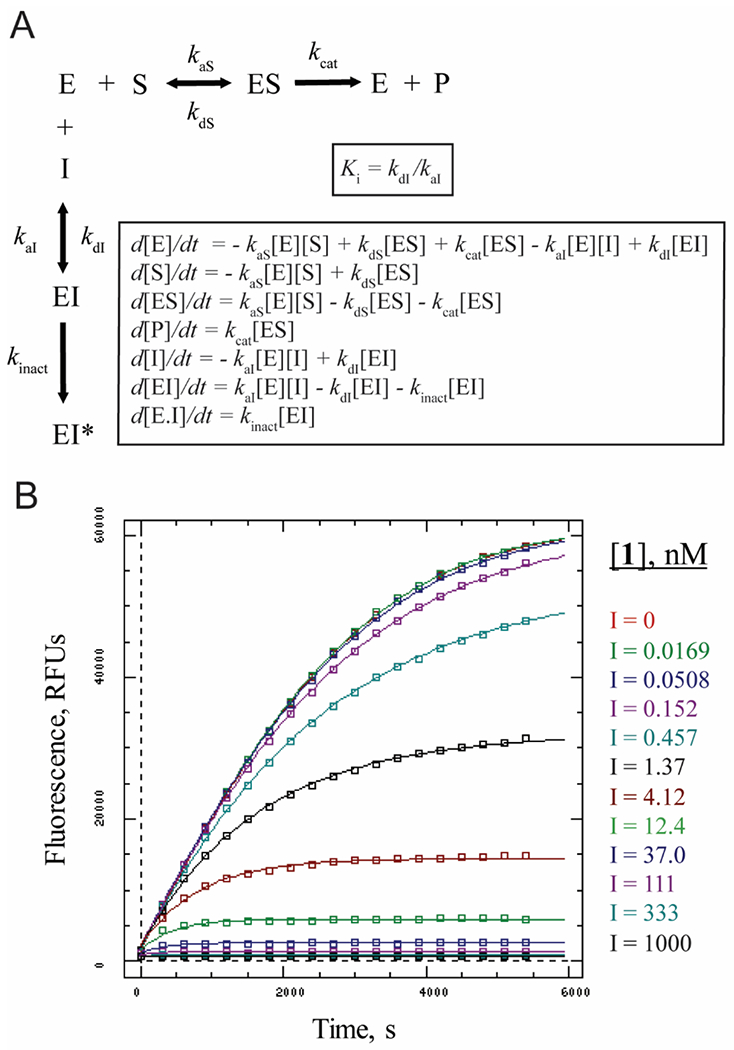
Figure 5: Kinetic analysis of gallinamide A inhibition of cathepsin L.

A. Reaction mechanism and differential equations used to explicitly estimate kinetic constants from product formation curves. B. Representative data for gallinamide A (1) inhibition of cathepsin L. Boxes are experimentally measured progress curves of cathespin L activity with various concentrations of inhibitor, and lines were fit by non-linear regression. Note that I = 0 concentration overlaps with the lowest doses at 0.0169 and 0.0508 nM.
