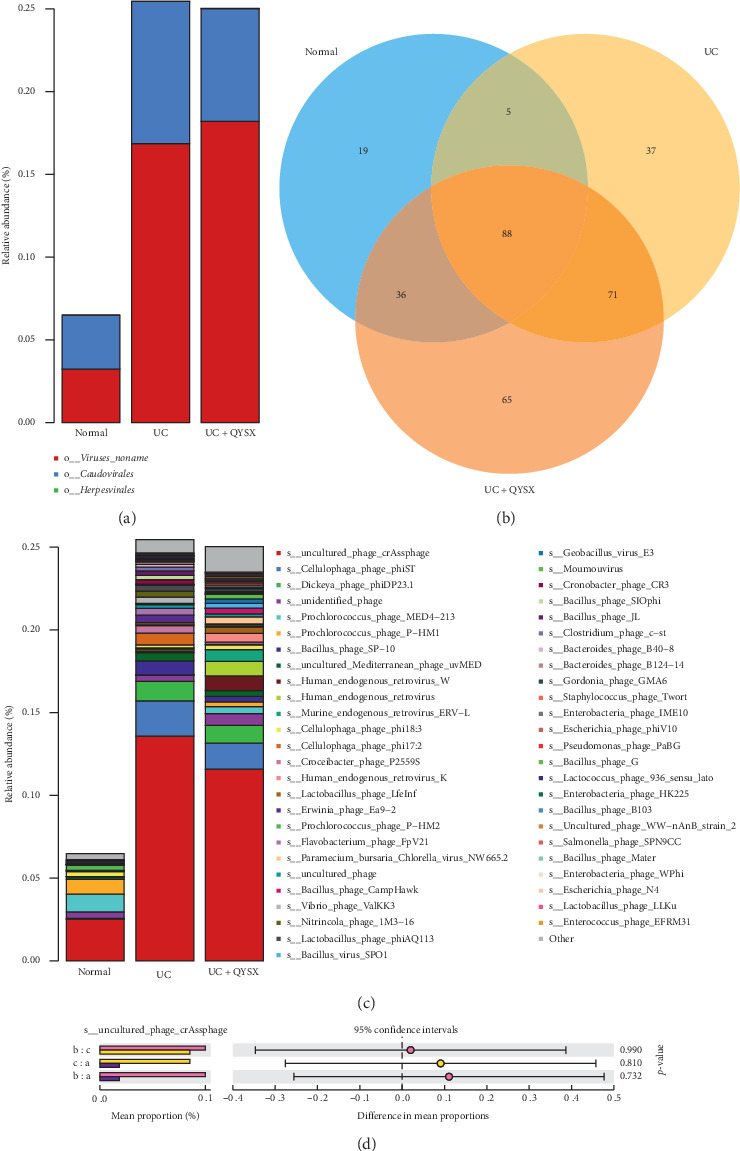
Figure 2.

The effects of QYSX on fecal virome composition in UC patients. (a) Relative abundance of fecal virome at order level. (b) Venn diagram analysis of viral species in the three groups. (c) Relative abundance of virome at species level. (d) The diversity of crAssphage among the three groups. Note: a, healthy controls; b, UC patients before QYSX treatment; c, UC patients after QYSX treatment.
