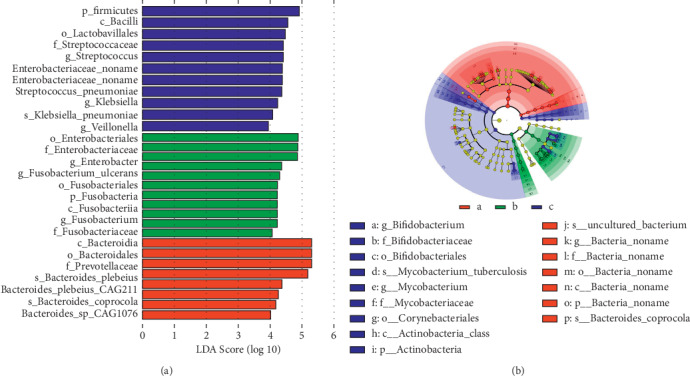
Figure 5.

Linear discriminant analysis effect size (LEfSe) to identify differentially enriched bacteria. (a) The bar chart shows differentially enriched bacteria. (b) The circles radiating from the inside out represent the classification levels from the phylum to the genus (or species). Each of small circles at different classification levels represents a classification at that level, and the diameter of the small circle is proportional to the relative abundance. The species with no significant difference were uniformly colored yellow, and the biomarker of the different species followed the group for coloring. Red nodes represent the microbial groups that played an important role in the red group, while green nodes represent the microbial groups that played an important role in the green group, and the color meaning of other circles was similar. Note: blue (a), healthy donors; green (b), UC patients before QYSX treatment; red (c), UC patients after QYSX treatment.
