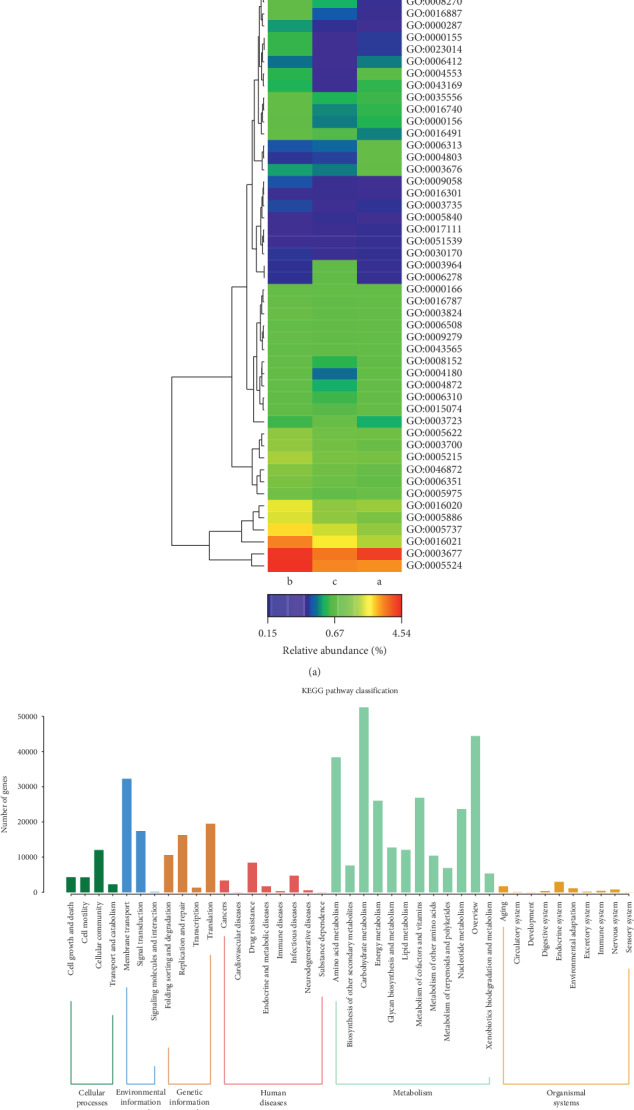
Figure 6.

Clustering analysis of Gene Ontology (GO) terms (a) and Kyoto Encyclopedia of Genes and Genomes (KEGG) pathways (b) enriched in fecal microorganism. The red represents high abundance, and blue represents low abundance. Note: a, the healthy donors; b, UC patients; c, UC patients after QYSX treatment.
