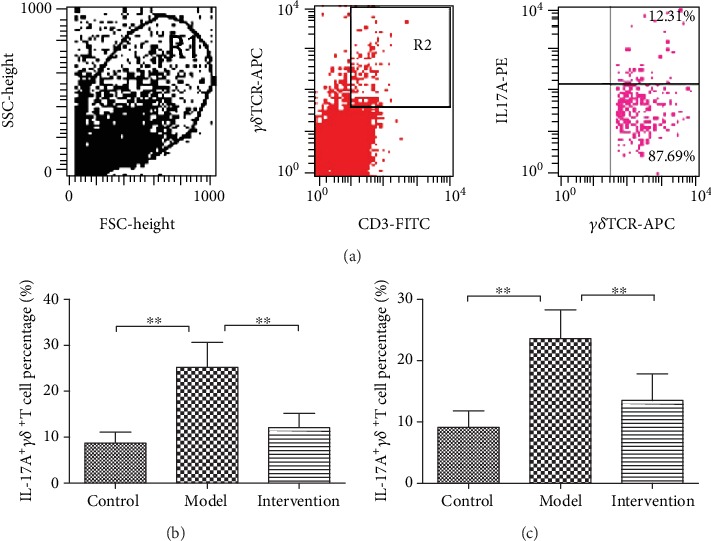
Figure 4.

The proportion of splenic and skin IL-17A+γδ+T cells (IL-17A+γδ+T cells/γδ+T cells%). (a) Representative pictures for IL-17A+γδ+T cell percentage. (b) Comparison of splenic IL-17A+γδ+T cell percentage among experimental mice (∗∗P < 0.01). (c) Comparison of skin IL-17A+γδ+T cell percentage among experimental mice (∗∗P < 0.01).
