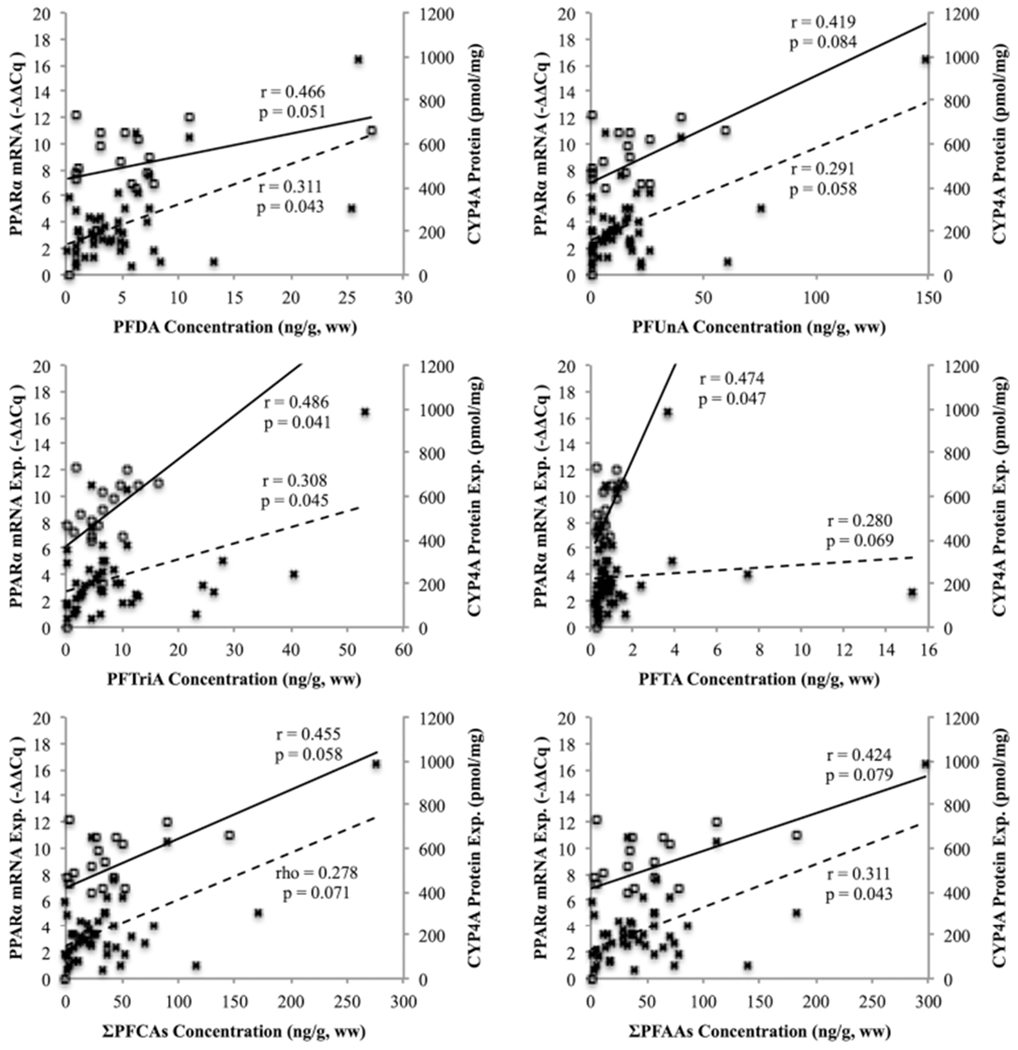
Figure 2.

Relationship between PPARα mRNA expression (open squares with solid line) and CYP4A protein expression (×s with dashed line) and PFAA congeners PFDA, PFUnA, PFTriA, PFTA, ΣPFCAs, and ΣPFAAs in kidney. Pearson’s correlation coefficient was used for PPARα mRNA expression with all PFAA congeners; PFDA and ΣPFCAs used log10 transformed data (df = 16). Pearson’s correlation coefficient was used with log10 transformed data for CYP4A protein expression with all PFAA congeners, excluding ΣPFCAs (Spearman’s rank test) (df = 31) (α < 0.10 denoting significance).
