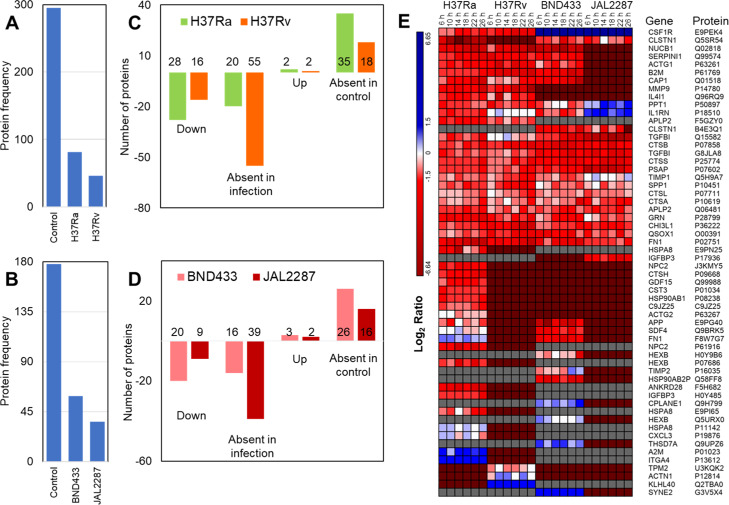
Figure 4.
Overview of NSS proteins identified for each strain. (A,B) represent the number of NSS proteins observed in the experiment with laboratory (A) and clinical (B) strain infections respectively. (C,D) depict the number of up- and downregulated proteins along with the unique proteins in either the infection or the control. (E) Heatmap showing the strain specific expression of proteins observed in uninfected and infected cells. The proteins expressed exclusively in control but not quantitated in any of the infections were excluded from this analysis.

